Monday 24 December 2012

Happy Holidays!!!

Warm wishes for happy holidays to all and merry Christmas.

Will be waiting for you at my new website


www.trading2day.com

Friday 21 December 2012

Introducing WWW.TRADING2DAY.COM

Dear followers and visitors,

I'm very happy to announce the beginning of my new website.

 From now on you will find my analysis at the web address below:


My 'profitablerisktaking' blog is moving on the next level, in order to continue to provide free high quality analysis and help on day to day trading issues and opportunities. Increased demand for a service to help traders and provide more detailed analysis with premium content available only to members, has made me confident that offering my premium services will be profitable for both parties.

Feel free to visit my new website at www.trading2day.com and share any comments regarding our new look or share your opinion regarding the markets via e-mail. Some features may not be fully functional (comments, premium services) but the free analysis is there as always.....

Thank you for your continuous support,

Alex

Thursday 20 December 2012

Greek General Index still inside 5th upward wave

The Greek General Index is moving upwards according to our wave count so far. The banking sector has proven a drag to the entire market but the General Index continues higher after having found support at the upward sloping yellow channel line. There is however a drawback in this specific wave count. The recent rise in prices from wave C at 758 is not a clear impulsive wave. This overlapping pattern may unfold into an impulsive wave, but until then bulls will have to be extra cautious. The sequence of higher highs and higher lows should also play an important role in an investors trading strategy. As mentioned earlier, the banking sector has proven to be a very heavy burden to this index. All in all, investors should keep in mind that after 5 waves up, a correction is imminent. Trading when the market is in wave 5 should be accompanied with strict stop loss orders in order to avoid unwanted 5th wave failures (inability to make new high). In our case however, if the 5th wave does not make a new high above 910,99, then our longer term view of a trend change in Greece will be at stake.
As always, thank you for taking the time to catch up with my thinking.

Short term bullish trend intact despite yesterday's correction


Although prices opened higher yesterday, the rest of the session was not as bullish as many have expected. SPX as shown in the chart at the left, still trades within the upward sloping trend channel. Prices topped and reversed exactly at the boundaries of the upper channel and may now be heading towards the lower boundaries. The form of the rise, unfortunately for bulls, is not a clear impulsive move. The unfolding waves have an overlapping form but with higher highs and higher lows. The picture is clearer in DJIA.

DJIA has made a new high as expected by our previous analysis in order for the 5 wave form from 12765 to be complete. If trend is bullish and our count correct, then another larger degree 4th wave is expected as shown in the chart on the right jand side. Bulls should start to worry if the dotted trend line is broken downwards and if wave i is overlapped. Having long positions is riskier at this level that a few weeks ago when we first changed to bull again. The sharp decline in metals could be an initial sign that shares could be next.

As always, thank you for taking the time to read my post.

Wednesday 19 December 2012

Could the double bottom in APPLE prove bullish?

AAPL has held support at 500$ level. A double bottom could be forming at this level with potential for the stock to start a new upward trend after having finished a  correction from 700$ to 500$. Although it is too early to call a longer term bottom at 501$, lets take a look at the levels AAPL needs to break for upward trend to resume.

First level of resistance is found at 550$ and then at 594$. The form of the rising prices will also play an important role if this rise is impulsive or corrective.  If you follow us on twitter, you would be informed at late November when price candlesticks provided us with a bearish signal of a doji pattern at the 594$ area. Prices have plummeted almost 100$ lower. Now we observe the opposite of that situation. A doji might not have appearred, but this double bottom could prove very bullish if prices continue to rise impulsively. 501$ should be held at all costs for this scenario to be confirmed.

As always, thank you for taking the time to read my new post. For more help don't hesitate to contact me.

Tuesday 18 December 2012

Dow Jones moves upwards in an impulsive form

Dow Jones has been moving impulsively upwards continuously making higher highs and higher lows as seen in the 60m chart displayed below. Our current wave count puts us in wave (iv) of iii. For this wave count to hold, prices should not fall below 13062 as this is wave (i) top. Instead prices should move higher to provide a new high above 13329 in order for the 5 wave sequence from 12765 to be complete.

As long as prices remain above the dotted upward trend line that connects wave ii-(ii)-(iv), bulls will have the upper hand and trend will remain upwards at least for the short term.

As always thank you for taking the time to read my thoughts.

Thursday 13 December 2012

EURUSD is 1.37 feasible?


Greetings to everyone and thank you for your wishes. After one week, I'm back online to discuss EURUSD today and what could be expected since I see a bullish pattern that is forming and that could be confirmed very soon.


EURUSD as mentioned in a previous post, was in an short term and intermediate term bullish trend. Support levels were 1,2950 and 1,2880. The break of the first support level pushed prices towards the second level  where support was found. Prices now trade above 1.30 after having moved impulsively upwards (chart below). Looking at the bigger picture above, prices have broken the downward sloping trending blue line and back tested it at the 1,2660 low. From that  point on prices moved impulsively towards 1,31 and now retesting the red resistance line. The chart above shows us that this red resistance line now at 1.3125 connects 3 tops. The break of this resistance could give us targets as high as 1.37. The chart below shows us the current most possible wave cound and its alternative. Trend remains up and prices should break 1,3125 resistance for our bullish scenario to continue to have more chances. A pull back towards 1.2950 could take place as a corrective wave ii of 3. If we are inside a bigger correction wave degree, prices could pull back correctively towards 1.2850. If prices push even lower we should be very carefull if the start of this impulse (1.2660) is breached. Then wave counts should be reconsidered.

Concluding, we are bullish specially if prices move above 1,3125 and pull backs towards 1.2950 could be bought with stops just below 1.29.

As always, thank you for taking the time to read my post.


Tuesday 4 December 2012

Blog inactivity for a few days....

Dear followers and visitors,

I would like to inform you that for the next few days my blog will not have new posts because I became a father today. Thanks for your support and I promise my comeback will be connected with a wind of change for my blog visitors and followers.

thank you for your support,

Alexandros

Monday 3 December 2012

GOLD longer term bullish trend still intact

Many blog followers have asked me to post my view on Gold so  here it goes. We have been bullish on Gold since 1525-50 level and were expecting a  new bullish upward wave to unfold. My belief is that gold is now at a corrective pattern that could complete near the 61,8% retracement or 1640$. Lets take things from the beginning. Gold has started its final 5th wave up were we note that wave E of the huge sideways triangle has ended.  From that time prices have moved impulsively upwards towards 1800 were resistance was too strong for prices to overcome. Our count is that this wave was wave 1 of 5. We believe that wave 2 is under way with an initial dip at 1672(50% retracement). Prices have bounced upwards but with no clear impulsive pattern. 1705$ is important support level as prices have moved upwards from that bottom in a 3 wave pattern. If 1705 is breached, then we would confirm that this upward move is corrective and with final target 1640 were wave 2 could finally end.Overall longer term trend remains intact with targets much higher than 2200$/per ounce. Short term trend remains bullish as long as prices trade above 1705 and as long as resistance at 1752 is broken and prices unfold impulsively. Currently gold has 1718 short term support that could prove helpful for bulls to re energise. Short term resistance at 1734-44-53$. The form of the rise will be very important as this rise if not impulsive could be wave B of 2.

As always, thank you for taking the time to read my thoughts!!!

Friday 30 November 2012

Will the upward move in EURUSD continue?

EURUSD has been rising steadily towards 1,31 unfolding in at least one impulsive (5 wave) upward move. If this entire rally from 1,27 area is just part of a corrective move, prices will soon start a sharp decline. The pair trades after having made a high at the 76,8% retracement level and after having completed an A--B-C correction upwards. For this scenario to be confirmed, we have to see 5 waves down that will initially break 1,2950 and then 1,2880. Breaking this important support levels will put pressure on the pair that could accelerate the decline towards 1,27 at first and even lower later.

The bullish scenario needs a small pullback of prices and then a new high in order to complete an entire 5 wave upward move from 1,27 lows. However this would again be the last part of an impulsive move, so a correction would be imminent.

The trend for now in the short and intermediate term is bullish and still inside an upward sloping channel. An exit from the channel would commence the start of a counter trend move downwards. Bulls still have the upper hand with 1,3100-3150 targets a good possibility. Why not 1,32 also...this level was mentioned in  one of our previous posts on EURUSD.

As always, thank you for taking the time to read my thoughts.


Thursday 29 November 2012

DOW and S&P to retest October highs!!!

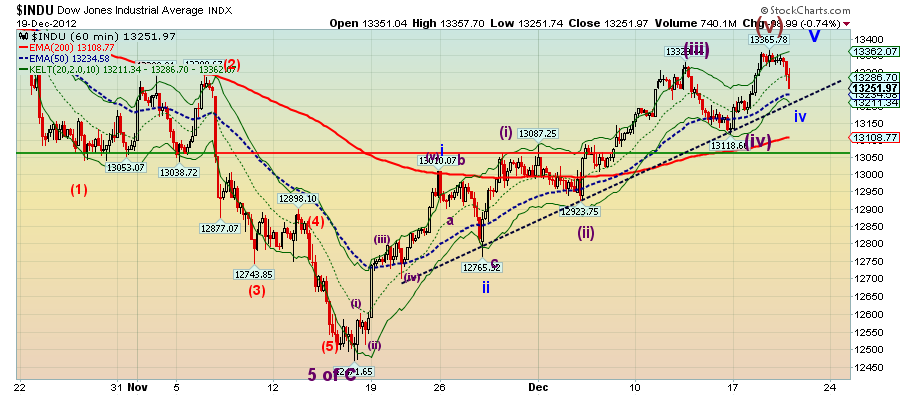
Yesterday's analysis gave 1384 in S&P as the level where prices were sure to trade. The index made a low just 1 point higher and then rallied and erased all losses. Not only did the market came to pare its losses, but it also moved even higher to close at 1409 area. We mentioned that it would be important to see the form the decline would take. At first I was expecting that this decline would only be wave A, but it seems that the 3 wave decline was the entire corrective downward wave. This means that we are now expecting an upward 3rd wave. DJIA and SPX have moved in a similar pattern finishing 5 waves up from recent lows and then made a 3 wave downward correction that completed at the 38% retracement.

That retracement level was our first target and it seems it has been achieved and the market seems to start a new upward wave. Prices in both indices not only made 3 waves down at 38% retracement, but prices also completed this correction at the same level as the previous 4th wave. 2nd waves tend to be more aggressive and finish near 61,8% retracement. However there is nothing here that cancels any of the rules of elliott wave theory. Our view is bullish for the end of the year and a double top could be expected to be seen. November lows are very important support levels that should not be broken for bullish view to remain intact.

As always, thank you for taking the time to read my new post. If you need help trading these indices don't hesitate to contact me.

Wednesday 28 November 2012

S&P starts downward move

S&P has most probably finished the upward move from 1343. Our belief is that the pattern exhibited as shown in the following chart is an upward 5 wave movement. This movement had broken the upward trending channel 2 days ago and yesterday made a back test of this broken trend line. The correction downwards is still underway and we currently are inside in its first part. The decline in S&P does not look impulsive, though we have to give the market more time to unfold its waves.


 As shown below, in the 60 minute chart, prices have broken the middle Keltner channel entering into a short term bearish trend. Important support levels are the 38% (1384)- 50% (1376)- 61,8% (1368) retracements. At least the first support level is going to be achieved, according to our analysis. The pattern and form of the decline will give us more information of whether the market is preparing to burst upwards for the end of the year or if it is getting ready to test the lows and reclaim the bearish action of the previous weeks.
As always, thank you for taking the time to read my new post.

Tuesday 27 November 2012

Why the Greek General Index is in wave 4?

Greek stocks reactions to the Eurogroup solution regarding Greek debt are mixed. Our view is that despite any short term uncertainty, Greek stocks are going to behave very volatile, until all the details are made clear regarding the solution announced. Our preferred view using elliott waves is that the Greek General Index has most probably finished wave 4 and has just started wave 5 upwards with 1000-1100 as target. There is also the possibility that the index is still inside wave 4 which is unfolding in a more complex pattern. Having connected wave 1 and 3, we drew a parallel line that connects wave 2 and the point were we believe wave 4 has ended. 

It is essential that the lower yellow trend line is being held. For bullish scenario to remain as our first choice, the General Index should not trade below 758 level. The most possible downward correction target from 850 level that we are currently in, is the 820 and 805 levels. 

If you need help trading Greek stocks or just want to talk about this market don't hesitate to contact me.

As always, thank you for taking the time to catch up on my thoughts.

Monday 26 November 2012

Was the S&P holiday rally real or just a decoy?


Using an updated chart from last week, if you followed us you were warned of a bottom at 1343 and expected reaction towards 1375. Having used our pitchfork support and resistance lines, long positions were never endangered as prices broke through all resistances. As shown on the chart above, the upper pitchfork resistance which is also the outer limit of the downward channel, was reached and retested and finally broken. When trading, taking into serious consideration waves is as important for me as the resistance and support levels depicted by pitchforks and highs or lows. Although our main view was that 1375 was expected to be an important resistance were wave 4 would end, prices showed that our alternative scenario that the correction has ended was stronger than expected. Any short position opened in the area of 1375 should not have been held above 1389 and reversed as prices broke important resistance levels.
The 60 minute chart above depicts our main most possible wave count to date. The decline from September highs is not a clear impulsive wave. Even the decline from 1464 is not impulsive. If we don't see an impulsive wave of a large degree, then trend has not changed....Prices are moving impulsively from 1343 lows and as shown on the chart below, the 5 waves could already be complete. The decline from 1409 Friday's close is important which form will it take. Long positions should be considered between 1360-80 area as this could be a potential bottom for the correction. Stop level is 1343 so adjust risk management accordingly.

As always, thank you for taking the time to read my new post.

Friday 23 November 2012

Daily analysis on EUSTOXX50 and IBEX

Taking the opportunity from the Thanksgiving holiday and the fact that US markets are closed, we focus on two European indices. The common ground between Eurostoxx50 and IBEX35 is the sideways volatile movement of the last month. Both indices have been trading within a trading range that although it may be tiresome to be watched, it is helpful because it provides us with clear support and resistance levels that we should trade based on them.

Eurostoxx50 as shown in the chart above is closing its trading range making it easier for us to trade. A clean break above 2580 gives us 2700 as a target. Resistance of the downward sloping trendline at 2540 could be used for entering short positions. Support at 2430 could be the downward target as the 200 EMA is also found at that level. From the Elliott wave perspective this sideways overlapping pattern is corrective and it is more probable to see a break out above resistance. Long positions should be considered near support levels or after a clean break of resistance levels.

 IBEX35 as shown on the chart above has made a similar pattern during the last month as Eurostoxx50. The movement of prices is sideways with a small downward slope. Recent daily closes find IBEX just above the lower pitchfork support as depicted in the chart. The trading range in IBEX is between 7490 and 8150. The index displays no clear impulsive move towards any direction. The trading strategy adopted should be similar to the one mentioned above. An upward break is more possible due to the absence of a clear downward impulsive move. If the sequence of lower highs is broken in IBEX (8000-8150-8230) then a new upward move will be triggered. Always trade near support or resistance levels or after a break out.

As always, thank you for taking the time to read my post.


Thursday 22 November 2012

EURUSD stairwell to 1,32 or just another upward correction?


EURUSD despite the negative climate surrounding Eurozone and the inability of EU leaders to reach an agreement at the recent Eurogroup meeting, the pair is rising steadily from 1,2660 level. Prices have  broken out of the descending trend channel and is pushing higher towards 1,2850. Resistance is found at 1,2870 and 1,29 area. The decline from September highs near 1,32 is clearly in 3 waves. This puts the downward impulsive scenario into question. So bigger picture not so clear yet.
Taking a closer look at EURUSD we observe that the rise from 1,2660 is also overlapping and there is no clear impulsive wave action here also. How can we trade this though? Short term trend is upwards with important resistance to be tested at 1,29. This upward moving pattern could develop to an impulsive wave if news from european leaders are positive regarding the solution to the debt crisis in Eurozone. The upward moving purple trendline should be watched and prices should not break the 1,2750-1,2725 zone for the bulls to have more chances.

If you need more help understanding my charts or any help trading EURUSD, don't hesitate to contact me. 

Thank you for taking the time to read my post.


Tuesday 20 November 2012

DJIA complete wave count

Today's chart focuses on the wave count we prefer and the alternative for DJIA. The common ground between those two counts is the fact that we have 3 waves down. 

Scenario 1: Move from 13661 is impulsive and wave count is depicted with blue letters and numbers. We are currently in wave 4 which retraced back inside the lower degree wave 4 and should not overlap wave 1 low at 13296. Of course this overlapping condition is a bit far away and that is why we have to find other signals to confirm if we are in wave 4. Resistance of the upper pitchfork line is one of those lines that should not be crossed. Wave 5 down is expected towards 12400-300. 

Scenario 2: The decline from 13661 is corrective and complete. The wave count is depicted as the alternative (ALT) in the chart above. The bottom that started forming last Friday is showing impulsive patterns with an upward bias. This could be part of a larger bullish move-wave. Clear 5 waves have been formed from the low at 12471.

For more help trading this index don't hesitate to contact me. Thank you for taking the time to read my thoughts.

Greek stocks preparing for a rally or a crash?

Greece has been on the spotlight and at the centre of attention for some time now. Specially during this week, several matters regarding debt viability and the next tranche of aid are being discussed in the Eurogroup meeting. The recapitalisation terms of Greek banks together with the delay of the money aid, have been the causation for the steep decline from recent highs according to the media. Our view was expressed before all these 'announcements' that bulls should be cautious as a 4th wave was expected. All these are based on the 'good' scenario that trend has changed and the General Index is trying to complete 5 waves up from June lows. This does not mean that the 'bad' scenario has less chances. If the index doesn't complete the 5 waves up, then the chances for a trend reversal scenario will lose power. For the 'good' scenario to have increased chances, the General Index must be in the 4th wave that is unfolding like a triangle (a-b-c-d-e) or has already finished its correction (a-b-c). Important support is  depicted by the yellow trend line.

 Fans of the bearish  scenario are seeing this correction as part of wave 2 up. Wave 1 down was the decline from 910 to 754. This scenario might still have chances but the internal form of the decline is not as a clear impulsive move as we would want. Nevertheless we should take into consideration this alternative very seriously.

Concluding, trend remains sideways for the very short term. Above 844 level, 'good' scenario will gain points as the triangle scenario will be ruled out. If the market takes more time to move sideways then we confirm the triangle scenario. If prices break the yellow support, the 'bad' scenario will be gaining points and bears will be taking the upper hand.

Thank you for taking the time to read my new post.

Monday 19 November 2012

Short term bottom in S&P

 Today's focus is once again the S&P index because it is showing signs of a potential short term bottom after the pull back last Friday. We had mentioned before through twitter and through a post in this blog, that as long as the index remained under 1362 area it would first visit 1345. Friday was that case. The index got rejected at that level and declined towards 1345 making a low at 1343. That was our target and it was achieved as expected. 


If you had followed our charts you would notice that S&P had broken the short term pitchfork resistance (10 minute chart above) and back tested it after reaching our 1345 area target. This means that it is possible to have seen a short term bottom.
Taking a look at the 60 minute chart we observe that the middle pitchfork is proving a strong support that needs time to be broken. Therefore it is expected for the index to slide sideways and a bit upwards in order to meet the upper pitchfork resistance. The important resistance level that could be met in an upward corrective move is 1370-73. Trend remains down although our targets from 1400 have been met.

We consider that this decline is corrective and could even visit 1300 or slightly lower levels as an extreme but possible scenario.

Thank you for taking the time to read my new post.


UPDATED 10 MINUTE CHART BELOW:


Friday 16 November 2012

DAX to visit lower price levels

If you had read our previous analysis posted regarding the German Index DAX (http://profitablerisktaking.blogspot.gr/2012/11/dax-support-and-resistance-levels.html), you would have covered your long positions and even might have shorted this index below 7400 or even 7140. Today DAX is trading just above 7000 level with potential to decline further towards 6850. Support levels are being broken and as mentioned before, the downward moves feel impulsive whereas any upward bounce looks corrective.That was our initial warning signal when DAX was trading at 7350.

Our first target for a potential bottom in DAX is near the 38% retracement.6850-70 area should provide a strong support for this decline to pause. 

Trend remains downward biased and  resistance levels at 7150, 7220 and 7300.
Support at 6870.

Thursday 15 November 2012

Daily progression of waves in S&P to remain weak.

Our analysis on S&P has given follower another 16 points yesterday. S&P not only got rejected at 1390 area (1388 high) during regular session, it tried again yesterday in pre-market to reach those levels again and got rejected once more. It was clear that selling at that point using Tuesday's highs as a stop could prove very profitable. Moreover if prices were to break 1370, they were expected to be pushed lower towards 1360-50 area. And that is what really happened. Prices broke support level at 1370 and the index closed at 1355 with 1352,50 as a low. So even if you followed the strategy to sell when 1370 was broken, you would at least have profited 10 points (1360) or more.

What now? Bears have the upper hand and it seems like the index will visit lower price levels. Support is now found at 1345-35 area. Prices could bounce upwards as a short term correction that will be met with selling pressures once more. 1403 is an important price level at the time being as it was before it was broken. Now however bulls are on the run and want to try to push prices above that level as bears were on the run when the market was at 1470-60 and wanted to break it.

Taking a closer look at our chart, you can see the potential wave count plotted on the chart. When the entire move from October highs is finished, we will have a clear view of whether the decline is impulsive or corrective. Many things change on how we count the last upward wave in S&P where it failed to produce a new high (DJIA did produce a new high). For the time being prices move downwards impulsively.

Resistance levels to keep in mind are 1361,50-1381-1390-1403

Support levels at 1345-35

Direction bias : down

Thank you for taking the time to read my post.

Wednesday 14 November 2012

SPX needs to break resistance now or it will fall harder


S&P managed yesterday to climb 17points from its low at 1371 towards 1388. As mentioned through twitter yesterday, prices needed to have broken the 1390 resistance for the market to continue rising. The market however got rejected at the first important resistance we noted and pulled back sharply and closed at 1374.

On the daily chart we see prices crawling on top of the lower pitchfork support and right on the 200 EMA. Prices should bounce from here towards 1395 where the middle pitchfork resistance lies. From the Elliott wave perspective in the daily chart we see overlapping waves that could possibly be counted as two pairs of 1-2 waves. Prices paused at the 50%  retracement. We could very well be in wave C downwards or in an unfolding impulsive wave. Prices are expected to continue lower.


On the hourly chart, prices move sideways in the lower pitchfork support. The upward thrust at yesterdays session that pushed prices to 1388, was rejected at our resistance and with no clear impulsive pattern. This upward move could very well be just another upward correction before downtrend resumes. It is clearer at the 10 minute chart that the upward move is more like a 3 wave pattern than a 5 wave move. Weakness to break above 1390 confirms that the upward move is corrective. Prices below 1370 could accelerate the decline towards 1360 to complete the impulsive wave. As mentioned in previous posts in the last few weeks, 1300 is the important support level. If the decline from 1474 is corrective, the minimum targets are achieved but no clear impulse upwards is found.


Our main objection regarding the decline from 1474 and whether it is an impulse, is found within the form of the decline from 1474 to 1430. It is in 3 waves and that is why I still count the whole decline as A-B-C. Time will tell if we are correct. Until we see some upward impulsive action, we will be very cautious with trading in the long side. If the market continues to move sideways and eventually breaks 1370, this event will make us wait for a bottom around 1350 where the 61,8% retracement is.

Always trade taking into consideration the support and resistance levels and don't trade with arrogance. Placing stops is the most important step in order to be successful. Never open a position without having considered your stop level. If you need help trading and using my charts, don't hesitate to contact me.

Thank you once again for taking the time to read my thoughts.


Tuesday 13 November 2012

Greek General Index wave analysis

Greece has been on the spotlight and at the centre of negative publicity for some time now. Greek stocks however, from mid June have staged an upward movement worth of taking into serious consideration. The Athens General Index has risen in a 3 wave pattern from 471 to 910 level. Now at 770 level it is most probably forming a sideways triangle to complete wave 4 correction. A less probable wave count is that it only completing a simple a-b-c correction as part of wave 4. Therefore it is expected that a wave 5 towards new highs will follow. Many investors however believe that the 3 wave rise from 471 to 910 has been a correction and not part of a larger trend change process. They believe that new historic lows are to be expected combined with a possible credit event regarding Greece or a GRexit. 

This scenario is something that we feel is less possible as market sentiment is close to that belief. When market sentiment is close to extremes, prices always move the other way. Our preferred  view is that of a general upward trend change that is under way in Greek stocks. This scenario will be confirmed and supported after 5 waves from 471 low are completed.

Thank you for taking the time to read my post.

Monday 12 November 2012

Can the trend in DJIA turn upwards again?

After the recent decline  in prices, many investors start connecting an impeding Eurozone collapse with another bear market, similar or even bigger to that of 2008. DJIA looks like it is falling impulsively. Prices have fulfilled 5 waves down from 13661 high. For many this is just wave 1 of  a larger downward move. Apart from that scenario we have to take into consideration the wave count that this new high was just an irregular B wave. Therefore the entire correction ending between 50% and 61,8% retracement could already be over. Even if it is not over, a pull back upwards is expected as part of wave 2.
Looking at the above longer term chart, we see that DJIA is near or just above critical long term support levels. 12700 level is important and should not be broken for bulls to have viable chances that the trend will resume upwards soon. 

Prices falling below 12650 and remaining under 12850, would decrease bullish chances and push prices even lower. 

Generall strategy regarding this index according to our analysis would call for covering short positions and taking profits.

Thank you for taking the time to read my new post.

Friday 9 November 2012

Can't say you were not warned about this decline!!

One of the most important trading signals   was given this week and our analysis has given notice to all bulls what would follow the break of such an important support. Futures now trade pre market near 1365. S&P has broken intermediate support and is heading fast towards our targets. Next important support levels is 1300.

As shown in the above weekly chart, S&P has broken the pitchfork support. This breaking down of prices could unfold to something much bigger than everyone expects. Very important support is the 1300 price level. Until then we shall focus in the form and pattern of any upward or downward move, in order to configure if trend has changed or the decline is just a larger degree correction.
 Another signal given from our charts is depicted above. It was also mentioned that every rally after a correction was smaller than the previous rally. Was the market running out of fuel? It seems that way and prices are now correcting sharply. Again our chart above gives 1300 level as an important support at the middle pitchfork.


 You can read our previous analysis alerts here:
My view is that corrections are welcomed. Prices should not and can not always rise or fall. The market as everything in life moves in circles. After an upward phase, comes the decline. We should be prepared and not stubborn, we must be flexible and ready to change our views.

One should look at this decline as an opportunity to profit from shorting or the opportunity to buy lower. Prices have just started their correction and we should be very careful when calling a bottom.

Thank you for reading my post and as always feel free to contact me if you need help.

Thursday 8 November 2012

DJIA 5 waves down

DJIA has made a new low yesterday and the entire move from 13661 could have probably finished 5 waves down. However the time it took for wave 5 to unfold relative to the other waves is too small. Therefore my analysis gives more chances to the scanrio that only wave i of 5 is finished. Even if the entire wave 5 downward move is finished, wave 2 is expected to last several weeks since this downward wave took almost 1 month to unfold. Trend is down and a small pull back for a minor corrective wave is expected to be seen during today's session or at the open.

As mentioned in a previous post, it was essential that wave 4 would not overlap wave 1. It came so close but it did not overlap 13296. Blog followers who contacted me at that time, placed selling orders with very close stops at those levels and took this low risk opportunity. That is what we are after. Low risk opportunities. Riding the trend is good too, but snatching a profit of 300 points in Dow in such a small time frame makes you feel great!!!I hope we keep up the same pace. And never forget to place stops. 

Thank you for taking the time to read my new post.

Wednesday 7 November 2012

Bears in SPX still not strong enough

If you have been following our chart analysis for some time now, you will have noticed how precise our support and resistance have been proved. 

Tuesday's low in SPX has touched the lower pitchfork at 1408 price level. Support levels have been held as bears were not strong enough to break them. Since then, prices  have managed to climb above the middle pitchfork and make a double top just above 1430. Obama's win according to many traders will push prices higher. All I know is that if prices break above the 1434,27 high, their next target will be our before mentioned resistance at 1442 where the upper pitchfork trendline stands.

A bullish wave count (red) and a bearish wave count (blue) are also depicted on the chart. The common ground for both those wave counts is that prices will tend to go higher towards 1440-45 level. 

Still the 1403-5 level is important support. Price action above this level makes us believe that if broken, prices could collapse and we could have a small selling panic towards 1380-70. So beware of post election bullishness and always trade with a stop.

Thank you for taking the time to read my new post.

Tuesday 6 November 2012

DAX support and resistance levels

DAX has recently made a sideways movement with successive lower highs and lower lows. Although an overlapping pattern, traders should be very cautious with any long position. Short term support at 7300 and resistance at 7400 provide us with a trading range where we should be neutral. Very important support is at the 7100-140 level. Very important resistance is 7500. Trades should be made when resistance or support levels are broken. US elections could provide a bit of extra volatility in the next few sessions.

Prices still trade inside the upward blue channel and the bullish resumption of trend remains a good possibility. Breaking that channel downwards could push prices into a deeper correction.Another bearish sign that makes us be even more cautious is that the downward portions of this move feel impulsive, whereas the upward movements are corrective. Whether forming a longer term top or just an intermediate one, traders should be very cautious and ready to change strategy from long to short.

For more help trading this index, don't hesitate to contact me. Thank you for taking the time to read my new post.


Monday 5 November 2012

Signs that SPX could fall towards 1330-60 level.


 SPX after having completed 5 waves up at Friday's open, prices pulled back sharply as expected in our last analysis. Whether bullish or bearish, a pull back was expected. Moreover, the index could not manage to break and stay above our middle pitchfork resistance. That is an important level (1432) for bears now, as  a move above it could accelerate prices towards 1445-47. Next target that needs to be broken by the bears is 1404 area. A break below that level could accelerate prices towards 1380-90.

 Watching the daily chart, we observe that prices remain outside the upward sloping channel and Friday's open  made a back test of the broken channel. Such behaviour could be a sign that a move towards the 200 EMA(1374) is very possible to happen. The sequence of lower highs and lower lows in the daily chart is also a bearish sign that prices could fall further.
 Last chart today to watch out over the longer term is the crossing signal of my two EMA indicators as a bearish sign of further price weakness. Usually prices decline considerably after such a signal. This crossing combined with a break of 1400 level could confirm that bears have taken over. 

US election talk on how the market is going to react to it leave me uninterested. I feel it is very possible wahtever outcome, that prices could fall further continuing their recent trend. Many believe that an Obama win could be bullish for the stocks while the opposite will happen if Romney wins. Any reaction like that I believe it wll be shortlived. I prefer to ignore the noise and just wait for prices to speak for themselves.

Always keep in mind the important support and resistance levels given in our charts. Thank you for taking the time to read my new post.

Friday 2 November 2012

S&P wave count

Bulls managed yesterday to hold support and push prices much higher. Today we focus on what has changed in our wave counts given the new facts.

 For starters we have to cancel the bearish scenario that we were in wave 4 since it overlapped wave 1. Support at 1400 was held and bullish stop was not violated as mentioned yesterday. The bearish count calls for a second pair of 1-2 downward impulsive waves and we are currently in wave C of (2), which is about to top around 1442 (61,8% retracement). In pre market, prices have already reached 50% retracement. 

On the other hand bulls see the important low of 1397 not broken and the index rising upwards impulsively. At today's open the index will write a new high relative to yesterday. A pull back downwards and probably from 1440 level is expected whether the bigger picture is bullish or not. Resistance is now found at 1442 (61,8% retracement) and 1447 (upper pitchfork).

Critical support  at recent lows near 1404. If broken, then 1390-80 first target.

Greek General Index elliott wave count

Greek stocks have rallied hard since June. At first glance we can oberve the 3 wave upward move in the index until late October. Now it is time for things to get clear, whether we are still in an upward impulsive move or in a new downward move. Lets start with the bullish scenario. As depicted on the chart we can count this sharp decline as wave 4. It has retraced as much as 50% of wave 3 and it is time now to start rising in the final 5th wave upwards. This might be the final upward wave but also the confirmation of a longer term trend change. Wave 3 was 1,618% of wave 1. Thus most probable wave 5 targets are:
  1.  wave 5 is equal to wave 1, near 950 level.
  2. wave 5 is 0,618 times of wave 1+3, near 1025 level
  3. wave 5 is 1,618 times of wave 1, just above 1050 level.
This does not mean that the market cannot go higher. However these are the most probable 5 wave terminal targets.

If the market however has finished a 3 wave upward correction at recent high 910, then a new downward impulsive has started. An initial confirmation that a new downward impulsive wave has started will be given if the high of wave 1 is overlapped(662 level). Targets are new lows with all its consequences.

If you need help trading greek stocks, don't hesitate contacting me.


Thank you for taking the time to read my post.

UPDATE:
 Update of the most possible, according to our analysis, wave count for the General Index. Impulsive upward waves should continue to form for this count to be valid. Until now, one upward impulsive wave has been formed. Minor pull back expected and continuation of upward move with new impulsive wave needed. Small possibility that downwave completed is only wave A of correction. Less possible that upward correction fully complete and new longer term downward move started.

Thursday 1 November 2012

Impulse or correction?DJIA road ahead.

The aftermath of hurricane Sandy finds the markets trying to break above resistances early in the day but with no success. DJIA still trading inside the pitchfork but with no real direction in the last two sessions. From October highs, the index forms a 3 wave downward move. Short term trend remains downwards and it is more possible to see a new low as part of wave 5, assuming that this sideways movement is wave 4.  13039 low should be used as a stop for bulls, because if it is broken the market will most probably lose another 100 points at least. However this will be the final part of the decline that started from 13661 high. If the market on the other hand does not produce another low, the market will have only made 3 waves down. As mentioned many times before, when the market moves in 3 waves it is most certainly in a corrective phase. If the market holds this 3 wave downward pattern that would mean that a new bullish upward move will be starting soon. First obstacle for bulls will be the middle pitchfork resistance(13180-200). Next resistance that would cancel bearish wave counts is 13296 (wave 1 low). If prices move past that resistance, the impulsive wave count will be cancelled as wave 4 should not overlap wave 1.

Thank you for taking the time to read my new post.


Wednesday 31 October 2012

EURUSD and GOLD short term opportunities

 As mentioned yesterday at 1,2940, a triple bottom formation in this pair together with a break of the downward sloping trend channel would imply a bullish move were to be expected. Next resistance at 1,3010 area for EURUSD  a target that will most probably be hit today. Bulls don't want to see a pullback in EURUSD below 1,2930. A break above this resistance and a close above it for at least an hour will open the road for a move towards 1,3050.


Gold on the other hand has not made a break out yet. We expect prices to break above 1720 and give 10+ dollars higher. Our first target is 1730$ without canceling the possibility of higher prices.


I hope this short term update helps you with trading. Have a nice day and thank you for taking the time to read my thoughts!


Monday 29 October 2012

German DAX daily update

Today we take a look at German index DAX. At first glance, the index trades still inside the upward channel. The sideways movement from mid September until now looks corrective. The index has most probably bottomed around the 7100 level right on top of the channel boundaries. An upward move is most possible if support level and previous low at 7095 is held. The move from recent high at 7447 looks impulsive. This is the only worrying sign looking at the chart. This decline might be the start of a bigger degree move downwards towards 6750 and why not lower. 

Concluding we have to be cautious at 7095 level. Chances are now in favour of a bounce and a retest of the highs. If support is broken, then prices could decline sharply lower.

If you need help trading this index or understanding my charts, don't hesitate to contact me.

Thank you for taking the time to read my thoughts!!!

Friday 26 October 2012

Increased chances of an upward bounce in DJIA

Recent price weakness has pushed the index lower towards 13000. Prices have been supported at the lower pitchfork support. Prices are expected to bounce higher towards 13175-13225 resistance. Unfortunately our bullish expectations have not been met and prices fell below short term support levels and pushed the index outside the upward sloping trend channel (chart below). The market is expected to bounce from around the 13000 price level (38% retracement). 

The main bearish scenario puts the index in the start of  a large degree downward impulsive move. From 13661 high, DJIA has moved impulsively lower and according to Elliott waves it is in wave 3. Wave 3 follows all the necessary rules. It is stronger and bigger than wave 1, it consists of impulsive subwaves. For a bigger degree impulse to be complete, the 4th wave should not overlap the low of wave 1 at 13296.  If this scenario of a complete 5 wave downward move comes true, then bulls will find themselves at a very difficult position as much lower correction targets will be confirmed. 

So what now? Bulls will want the index to bounce upwards from this 38% retracement level and move past the low of wave 1. Price action will again show us  which scenario will prevail. Bears on the other hand will try to push prices lower in order for a complete 5 wave pattern from 13661 to be complete.

Thank you for taking the time to read my thoughts.