Thursday 31 May 2012

S&P in correction wave 4 scenario

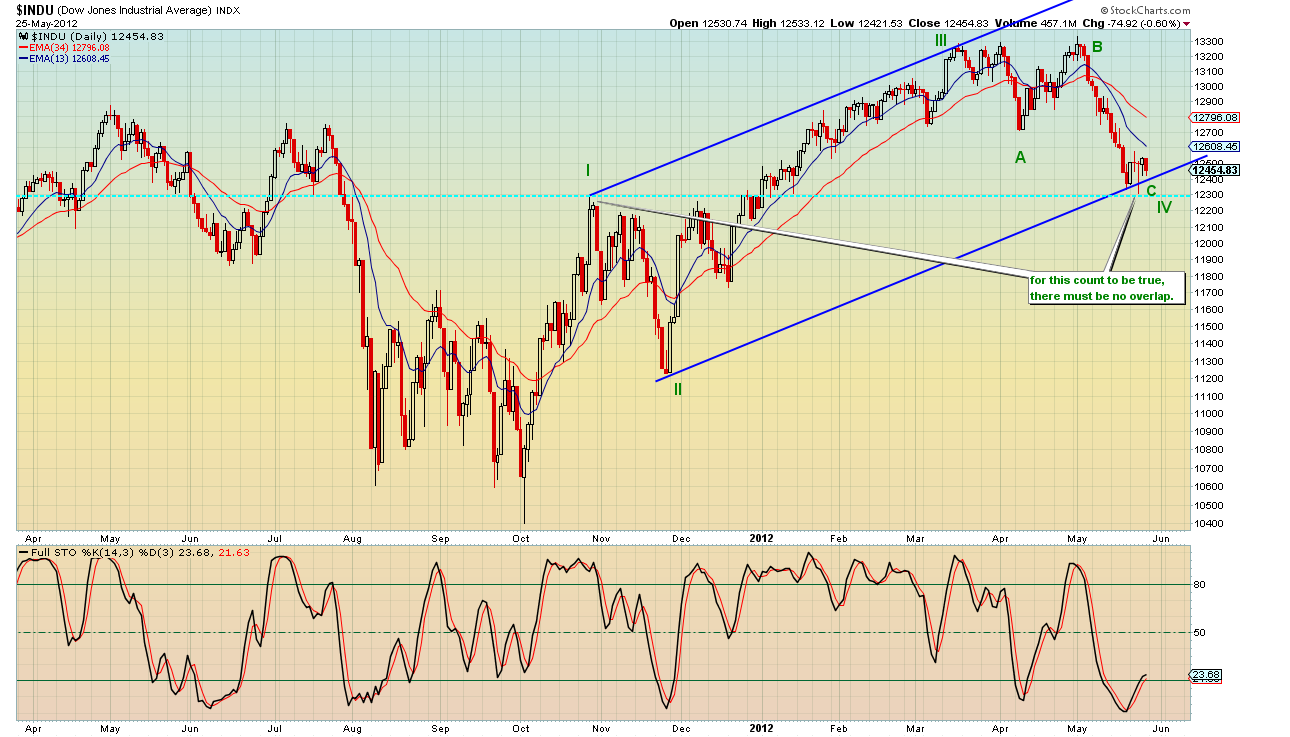
 The scenario that S&P is in wave 4 and a new low below 1290 will follow, is still very possible. S&P move from last low 1295 is not impulsive. From 1291 low the index has made 3 waves up. Wave relationships follow wave rules. Wave A is equal in size with wave C. However there is the possibility that this upward 3 wave move is just wave A, as the time it took to unfold is smaller relatively to wave 2.  Moreover a wave relationship near 1350 exists and this may be another target area. All this stands as long as 1291 low holds. If we see 5 wave down breaking that low, then wave 4 will prbably have ended. Wave 5 targets are found below 1270. The most possible target for wave 5 is 1255 where wave 5 is 61,8 times of wave 1 to 3. 1270 target is where wave 5 will equal wave 1. 1235 target is where wave 5 is 1,61 times wave 1. Again I will have to remind you that 1357 (wave 1 low) should not be overlapped if this is a wave 4. So adjust your trading stops accordingly.


Wednesday 30 May 2012

Will european indices rise again or will they crash?

 DAX has bounced as expected towards 6450 but the resistance at those levels was too strong for the index to overcome. However I expect the index to resume the upward move soon. Initial resistance at the middle pitchfork is at 6400-6450. Breaking those levels will push the index much higher. Breaking 6250 would push long positions to liquidate and move the index towards  6100 support. DAX, as well as the other european indices, is much weaker than the american ones, but I see there is more chance as long as S&P holds, that europeans will turn up once more.
 CAC bounced as well from the middle pitchfork support and found resistance at the downward sloping trendline at 3100 level. Breaking this resistance is important for bulls to continue to have hopes for a move higher. 2950 where middle pitchfork support is now must hold for bulls to have chances. Breaking this line downwards would be a win for bears and a further push downwards will surely follow.
Eurostoxx moves similarly to CAC and DAX, but looks much weaker. Support at 2100 is important. Bulls want to keep that level and see the index break above 2200.I think european markets will turn upwards soon if S&P holds 1300-1295 level.

Thank you for taking the time to read this post, for more feel free to contact me.


Tuesday 29 May 2012

Can greek banking stocks turn upwards?

 Greek banks may once again look attractive for traders. The banking sector index is within its downward sloping trend channel. Recent polls regarding the June 17 elections have given yesterday a good boost to all stocks and specially banks. The longer this positive mood stays, the larger the move.  The index might be in a similar position as it was at the start of the year, where banking stocks rallied more than 100%. Of course the result of the elections will be crucial as to the possible money inflow in the market or potential outflows from the banking sector due to fears of collapse.
 National bank of Greece monthly chart (log scale) clearly depicts 5 waves downwards. I won't get into pointing out possible longer term wave counts because it doesn't help in trading. However I show this chart because I want to point out the increased possibility of a sharp market bounce. This doesn't mean that the stock couldn't fall even further. The 5th wave may continue much longer,  but being in a 5th wave also means that it is a terminal wave too. The upward reaction to such a multiyear decline will give us the chance to take small risks relative to the potential gains.
 Even in the daily chart of National Bank of Greece the downward sloping channel is getting narrower. A small sign of short term bottom was created yesterday. Closing above 1,31 and 1,45 will confirm the short term bottom.

Sunday 27 May 2012

Rule of overlapping waves-Dow Jones

Things haven't changed much in Fridays session and nor bullish nor bearish scenarios got any stronger. This time we turn to DJI index and focus on the rule of overlapping waves of elliott wave theory. According to elliott wave theory, in an impulsive move, wave 4 should not overlap wave 1. Putting theory into action, we observe that DJI came very close. If the wave count depicted in the chart is the correct one, then we can assume that we won't see new lows, rather start a new upward move to new highs.
 
 Taking a closer look at the 60m chart, we observe that we can count 5 waves down from the highs within a channel and that the index has moved outside of the downward sloping channel. Bearish or bullish, whatever view you have, if you work with elliott waves you know that after 5 waves there comes a countermove. In this case, 5 waves down were part of a larger 3 wave correction and more specifically of wave C. If the next upward movement is in 3 waves, then the bearish scenario will strengthen. If we see 5 waves up we should expect 3 waves down and 5 more waves up. However this might prove to simplistic in real life and trading. Text book wave patterns do not happen very often and are not that clear in real life. However keeping things simple in counting waves is my major concern when trading with elliott waves.

Concluding we know what stop the bulls have after the recent 5 waves up (May 23rd low). Bear should wait 3 waves up before shorting again and cover positions until the low is broken.

Friday 25 May 2012

Everyone sells EURO.....anyone left to sell?

European debt crisis has put a lot of pressure in Euro as well as european indices. Political instability in Greece, increased borrwing costs in Spain and Italy, combined with large amount of deposits being withdrawn in Greek banks mainly, create an explosive mix and a sense of an impeding meltdown in the markets. Fear of the implications of a Greek exit pushes investors and traders to short euro and put their bets in USD. 

Technically speaking EURUSD after breaking the green neckline, the target was January lows. As analysed in our previous post (http://profitablerisktaking.blogspot.com/2012/05/eurusd-and-gbpusd-under-pressure.html) the pair has achieved our targets and bulls in euro one can say that are nowhere to be found. Support can be found near 1,2350 (middle pitchfork).  The fall from 1,33 is most probably complete and the pair will probably move sideways or even upwards to relieve some of the pressure. For now trend remains down, in medium and longer term level. In the short term we can see a bounce. Important resistances for EURUSD are the previously broken neckline but for me it is out of the question for a move back up there right now. I think we will visit lower levels in order for bulls percentage to decline even more and then will the decline end. Date of major importance is June 17th-18th where Greek election will be on the spotlight.

S&P ready for new up move or the end of the upward correction?

S&P having bottomed around the 1300 area, has made a double bottom 1291-1295 and is moving back up to test last high of 1328.  The downward sloping channel from 1415 has been broken. For me the move from 1415 has ended. So what now?


 Bullish scenario: S&P has finished 3 waves down from 1422 and starts now a new upward wave to break the highs and go towards 1510.

Bearish scenario: S&P has finished 3rd wave down from 1422 and will now make a 4th corrective wave. This wave should not overlap low of 1st wave (1357,38). Targets for the end of wave 4 are 1335 where A=C or near 1358 where A * 1,61=C.

Looking at a smaller time frame we noticed last time the possibility that if the low of 1291 was not broken, the last up move could be counted as a 5 wave up and a new upward move would follow. The market looks like it is ready now to break that high (1328) after the double bottom. Again  the form of the rise will strengthen one of the two scenarios. For me I like to keep things simple. So if I don't see 5 clear waves up or down I will not choose sides. In pre market things look certain that 1328 will be broken upwards. 

Concluding, the index is moving upwards according to plan and will soon clarify if this is a new up move or another upward correction.

Thursday 24 May 2012

APPLE is turning again upwards.....

 
 Today's focus is AAPL. It has reached our previously posted target (http://profitablerisktaking.blogspot.com/2012/05/aapl-targets-530.html) and the criteria of wave A equal to wave C has been met.  Although the support lines from the pitchfork and the gann fan have not been touched, there is impulsive movement upwards breaking downward sloping trend channels.
In the hourly chart AAPL is moving impulsively upwards and is one new high above 574$ to complete 5 waves up from 522$. This is a bullish sign specially if the new high is realised. The pullback should be baught with a stop at the lows (522$). Our initial target would be to break and close above 618$ which is our wave B top. This would erase many bearish scenarios and strengthen the bullish ones.

After the 5th wave is finished we will be on the lookout as to were the correction will end. Until then we have at least a week ahead of us.

Wednesday 23 May 2012

Bears are still alive in S&P.....


We were expecting a good bounce from 1300 level in S&P and the last 2 days it paid us well....reaching 1328, the index reached the top resistance of the downward sloping trend channel that starts from 1415. The rise from below 1300 could still be a 4th wave, so bears will have another chance to try to break to new lows. Even if a 5th wave is to come, it would be the last one and we should be on the lookout for possible truncation (i.e. double bottom without new low).


Examining closer the move of S&P from the lows we cannot be very confident of a 5 wave move upwards. However one can still see it as an impulse upwards. The decline from 1328 highs is until now in 3 waves. So we can assume that we are in minor wave ii after minor wave i (1291.98-1328.49).


Following the bullish scenario, we observe that with the 3 wave decline, the index has already retraced 50% of the rise. 61.8% is my tolerance level although text book rules mention that wave 1 cannot be retraced 100%. So if you are in favor of the bullish scenario get ready for a 3rd wave upwards. If you feel bearish, one can take advantage of the 4th wave and the expected 5th wave down to new lows or just wait for waves down to finish and then enter long again.

Tuesday 22 May 2012

Gold in new impulsive move upwards?


 In one of my previous posts I was looking at the end of the trinagle in GOLD around 1550 (http://profitablerisktaking.blogspot.com/2012/05/long-or-short-gold-and-s-update.html). 

It moved slightly lower for one day and then rallied more than 60$ upwards. My view remains bullish as long as it holds recent lows. However the fact that my 2 EMA have crossed for the first time since 850$ might prove bearish.

However this might just be the result of the lengthy sideways triangle correction. I will confirm the start of the upward move if the triangle is broken upwards and the move has an impulsive form.

European indices stop decline

 European indices have reached their support levels near the pitchfork supports as shown in the charts and move upwards. Yesterdays S&P 20 point upward move was another reason europe looks ready for an upward bounce. The form of the rise will determine the nature of the recent bottom.

DAX middle pitchfork resistance at  6400-6450 may put a stop to the rise. Any close above those levels can push the index to 6600.
CAC has a more bearish chart from DAX with a larger percentage decline relative to the September-April rise(61% retracement).
Eurostoxx is even worse. The retracement is reaching 76% from the entire rise from September to April. The most worrying detail I see in CAC and Eurostoxx charts is the corrective form of this entire rise. I cannot see an impulsive move as overlapping waves dominate the chart.
 
MIB on the other hand is below the September lows. Still inside the downward channel, MIB reminds me of the Greek General Index a couple of years ago.

Concluding I can say that the weakness in countries smaller than Germany and France has a negative impact in their economies. If things don't get fixed or a more viable program is introduced for these economies to exit recession, things are going to get uglier than in 2008-09. Of course the european debt crisis will surely affect negatively the already fragile US recovering economy. Closing with a positive note, if politicians manage to work out all the problems and obstacles the solution to the european debt crisis could lead markets to new historical highs.


Monday 21 May 2012

Greek stocks could bounce but no clear sign of reversal yet

 One of my followers asked me to make a comment on the greek market and National Bank of Greece, so today we provide a small analysis on troublesome Greece.
National Bank of Greece hit the lower line of the downward sloping trend channel. A short lived bounce can be expected up to 1,40. Pressure is high in greek stocks and June 17th elections will be a critical point in both the country's and the stock's future. A close above 1,55-65 area could become  the start of a bullish trend change. Resistance levels at 1,80 and 2,10 are next.
The strategy followed and suggested up to now in greek stocks was to remain in cash and ready to pull the trigger until the right bullish signals appear on the chart. FTASE20 as shown in the chart above has reached the lower red support line and may be in position to give an upward bounce, but with no signal for a trend change yet. Intraday trading is prefferred as volatility is hign in greek stocks this period.

Sunday 20 May 2012

S&P to test longer term trend

S&P is testing its long term trend and the bullish wave scenarios. I always say that corrections are welcomed and a healthy market does not always move up or down. It must move in cycles in order for buying and selling powers to recharge. From the weekly chart I have support at the 55 EMA and the potential previous wave 1 top. These levels should at least give the index a good bounce of at least 38% retracement from last important high (1415).

The hourly chart confirms the downtrend in force, but also the fact that it is oversold and a bounce is imminent. The whole move from 1415 could be a 5 wave down as part of an impulsive wave or the last part of a wave C correction. There is a smaller chance that from 1415 we have 3 waves down and that we should expect a 4th and a 5th. This is more bearish as it will penetrate the longer term supports invalidating longer term wave counts. A move above 1350-60 could prove as  an early sign of the longer term bullish trend resuming. Confirmation would be above 1415.

In shorter time frames we confirm once more that a downward trend is in force. Previous short term highs at 1300 and 1308-9 should be broken if a bounce is to give a 4th wave or the end of this decline from 1415. The lower lows and lower highs will in my opinion be interrupted this week. A failure to do so will not only strengthen bearish short term trend but also the possibility of a longer term trend change as important as March of 2009.

Friday 18 May 2012

Time for a bounce in S&P....

 S&P is now in dangerous territory. Moving much lower than 1300 will give rise to concerns as to whether the move from 1422 is corrective or a new impulsive move. Bearish stops look confident all the way down. The bullish scenario sees the index in the final stages of finishing a 5th extended wave of corrective wave C from 1415. The bearish scenario sees the index in its 3rd impulsive wave down. For bullish scenario to remain in play, S&P cash should make a bounce to at least 1366. First sign of such a bounce is to see the index hourly close above 1325. Bears could expect a bounce to those levels as part of a 4th wave.
Personnally my 1340-1310 targets have been achieved and I'm out of all my short positions although there is good chance we see below 1300 the next week. I may try to sell again around 1315-20 with  stops close by, but I want also to be ready to go long any time. As I say all the time, the market may move upwards and it is essential to do it in an impulsive way in order for the rise to be sustainable. These levels might mark a very important intermediate term bottom as a 4th wave and the start of a new upward wave. Concluding, trend remains down and may be ending this decline soon. Be alert for any reverse signals.

Thursday 17 May 2012

AAPL targets 530$

 APPLE broke 555$ and bounced from the middle pitchfork support. As mentioned in previous posts, 555$ should not have broken for bullish scenario to remain intact. However this break was expected to happen as the stock retraced too much. Now the road is open to reach 530$ and why not lower.
From an elliott wave perspective we are most probably in a C wave down towards 530$ first target where wave C equals wave A. Both lower pitchfork support and gann fan support lies at 520$.  At 505$ area we have the 50% retracement support and at the area of 470-480$ we have the 200 EMA, 61,8% retracement and A*1,618=C. However this is a scenario where the decline from the April highs is corrective. First important resistance now is at the area of 570$-575$ where the 50 EMA is and the previous high before the new low. Shorter term resistance is at 553$ at the upper pitchfork. Bearish to neutral is the my view in this stock. Above 575$ I will change.

Wednesday 16 May 2012

No positive signals for greek stocks yet....

 We revisit National Bank of Greece, after the recent anouncements of the impeding new elections early June. NBG still fighting inside the falling wedge, unable to close above 1,60 although it made a slight move towards those levels, it didn't manage to hold it. News that Greece is planning new elections, pushed the stock towards 1,30. The lower level of the wedge is near and above 1,20 right now. This doesn't mean we will certainly see those levels. A move and daily close above 1,57 can be bullish for the stock.
The banking index is sliding downwards below red resistance line. There is still no sign that a significant turn in the trend is near. Resistance at 183-200. Our strategy stll remains neutral, in cash, watching in the sidelines and taking part only in intraday trades.

European indices near support soon.....

 With S&P within the levels of our target area of 1340-1310, and the possibility of a good upward bounce a good possibility, european indices are closing on their supports.

 DAX now at 6300, has support (lower pitchfork) at 6250-6200. 6440 is short term resistance. 6500 is next resistance that if broken upwards the trend changes to up.
 CAC is at the same positionwith DAX. Support lies at 3000 level. Low up to now was in that area. 3100 level should be broken upwards to stop the lower lows and lower highs.

Eurostoxx with support at 2100 and a low near 2140 today is bouncing slightly higher. Again a lower pitchfork support lies near these levels which could be an important bottom.

Initial bounces in european indices I believe will be followed by new lows. Then I think markets will be ready for a new bigger bounce, that will clear any doubt regarding the impulsiveness of the declining waves among most markets. Reactions are being sold but I give high possibilities that the next reaction will hit bearish stops. Be carefull if you entered short positions recently.

Tuesday 15 May 2012

Has the longer term trend in S&P changed?


The move from March 2009 lows up to now, has been one of the most discussed topics among elliotticians whether it is a new impulsive or a big wave 2 of C. Until now bulls have proved dominant. Bears don't give up and 1422 in S&P cash was one more top they called that it was the final one. As you have read in previous posts we called the top quite soon and we gave the area of 1340 as the most probable target as it was the previous 4th wave. The level of 1340 down to 1300 is very important in my opinion. A decisive break below 1300 is strengthening the scenario that the trend has changed.
Until now we see 3 clear waves down from 1422. The market is trending lower and 5 waves could get real as european debt crisis and instability in southern european countries puts pressure among risky assets. One sign I'll be waiting to check is to see if my two EMAs will cross. Most of the time, when they crossed, a big move followed.

Taking a closer look at S&P, we could be in an extended 5th wave with target towards 1315. The most bearish scenario however is that we are already in the next wave down. 1345 should hold for the market to continue downwards in the short term. However we should have in mind that there is also a chance that this whole move from 1422 will end as a 3 wave down in these levels, and new upward move may start. We have to consider the most probable scenarios and be ready to trade as easily the long side as the short one.

FAZ-SH-AAPL update

FAZ is an option if someone wants to take advantage of the falling markets without being involved with derivatives. A double bottom formation with a new high yesterday may be the start of a new upward move. Buyers should have low 20s as a stop.
 The same stands for SH (Pro Shares S&P Short). It is very similar to the inverted chart of the S&P. If someone doesn't feel comfortable with derivatives, then this is a good option. A 2$ stop at the lows of 35$ is important for any one who buys it. It is the same as having a stop in S&P at the high of 1415. However we should take under serious consideration that 1340 is being strongly tested for some time now and it still holds. Upward break should be traded imho.
AAPL scenario of H&S is now cancelled and soon the 555$ lows will be tested and most probably broken. Next support/target is 536-503$ and then 450$. A trend change would occur most probably when AAPL breaks 576$.

Sunday 13 May 2012

Long or short? GOLD and S&P update

Today I chose to post a longer term chart regarding gold. As I mentioned in a previous post last week, a move below 1620-1610could see a push in gold from 60 to 100$ lower. We are probably midway there. However bears should not get carried away. A big triangle coulde be at its latter stages (wave E) and new thrust upwards could be next. The first target for wave E to end is between 1550-1570. If the support at 1550 is broken we could test the lower pitchfork support. However I see this as the least probable scenario. If wave E has completed, then we should be prepared to go long specially if 1650-70 resistance is broken upwards. Concluding, short term bias is still bearish but one should be ready to close and go long as this could reverse to the upwards very soon.


 S&P is trading at an important area of intermediate support. As can be seen in the 10m chart, the move from the lows is choppy and not a clear impulsive one. S&P Friday's high is important short term resistance. 1340 if broken the index could go within 2 days towards 1300. If 1366 is broken then 1380-90 is the next target.


Looking at the 60m chart I notice the following. S&P is still below the middle Keltner channel, and the upward move still doesn't look a clear impulsive one. An hourly close above 1370 can push the index towards 1400. As mentioned in previous posts 1340 is very important support and the index has managed 3 times already to bounce from these levels. The red scenario depicted in the chart shows that 3 waves from the highs of 1422 could already have finished. We coulde very well be in the proscess of small 1-2 waves, that is why 1340 is stop for bulls and 1369-70 for bears, as this could evolve into a new impulsive wave to new highs. There is also the possibility that we are still in a corrective wave after 5 down from 1415 and we may see a C wave up towards 1390-1400.  

Concluding, traders should be aware of the following levels in S&P cash:
  • 1415,
  • 1400
  • 1369-70,
  • 1340
  • 1290

More updates will follow this week in www.profitablerisktaking.blogspot.com and feel free to contact me at ec97aay@gmail.com.

Friday 11 May 2012

CAC and Eurostoxx to accelerate downwards....

CAC has made an impulsive wave down from 3600. Wave 2 is either completed and a move to break the mid pitchfork support has already started or we are about to see another upward wave ( Wave C ) towards 3300. The bigger picture count of CAC is bearish. At least the bearish count is the more viable for my criteria. For the time being, as long as this index is above 3100, new lows will be avoided. The crossing of the two EMAs is a bearish sign for the longer term.
Continuing from where we left at CAC, the same stands for Eurostoxx regarding the crossing of the two EMAs. Again the most strong count here is the bearish one. In both cases the market has been rejected at the upper pitchfork and ready to test the middle pitchfork support. Many may try to count this downward waves as a second wave 2. For me this is less possible to stand because if this down move from March-April highs is a wave 2 of smaller degree, then it shouldn't be larger in time and in size relatively to the 1st and 2nd wave of a larger degree.

Concluding, things don't look good for those two indices. Entering long positions should be followed by relative stop orders as this can evolve to something very ugly, as it did for Greece.

NBG rejected at resistance

Yesterday NBG and the rest greek banks rallied due to the hopes of the creation of a new goverment by most political parties. As mentioned in yesterdays update NBG's falling wedge had resistance at  1,60-65 area as shown on the chart. Although it managed to reach those levels, the pull back was fast and violent towards 1,57 and below the resistance. Recent lows at 1,32 might be revisited if politician efforts prove fruitless. Daily closes above 1,60 would reinforce bullish trend towards 2. 

Thursday 10 May 2012

AAPL ready to fill gap at 580?

AAPL has broken the downward sloping pitchfork resistances and has formed a small H&S pattern that could lead to filling the gap at 580$. Moreover as long as it holds above 555$ it may test higher levels. If 555$ broken, then 536$ (36,8% retracement)  and 502$ (50% retracement) are next levels of support.