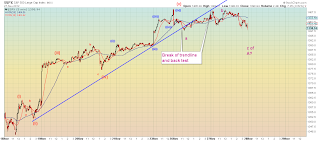
S&P has most probably finished the upward move from 1343. Our belief is that the pattern exhibited as shown in the following chart is an upward 5 wave movement. This movement had broken the upward trending channel 2 days ago and yesterday made a back test of this broken trend line. The correction downwards is still underway and we currently are inside in its first part. The decline in S&P does not look impulsive, though we have to give the market more time to unfold its waves.
As shown below, in the 60 minute chart, prices have broken the middle Keltner channel entering into a short term bearish trend. Important support levels are the 38% (1384)- 50% (1376)- 61,8% (1368) retracements. At least the first support level is going to be achieved, according to our analysis. The pattern and form of the decline will give us more information of whether the market is preparing to burst upwards for the end of the year or if it is getting ready to test the lows and reclaim the bearish action of the previous weeks.
As always, thank you for taking the time to read my new post.


Hi Alexander,
ReplyDeleteinteresting view, similar to mine that you can see in elliottfibonacci.blogspot.it
If you have time look also FTSEMIB, the Italian stock market index (Borsa Italiana page).
Italy is the real nuclear bomb worldwide, much more of Greece, with 2000 billion €uro of debt!