Saturday 30 June 2012

S&P bullish case

 The last few weeks our focus has been the bearish scenarios for the S&P. Our favorable bearish scenario, as posted yesterday, was in favor of a more complex upward correction with the form of an A-B-C-X-A-B-C. After Friday's rally the chances that 1363 cash will be broken upwards have increased substantially. Thus cancelling the scenario that wave 2 was over, but increasing the chances that if we are in wave 2, then this will probably end near 1380 but certainly above 1363. 

What about the chances of a new bullish upward move that will break 1422 and might reach the 1500 level? Is it possible? Is there a bullish wave count that supports the 1500 target? There are some signs of  impulsive moves upwards but there are also some drawbacks in them too. Taking a close look at the daily S&P chart below, you can notice my bullish wave count since June lows. The waves are overlapping but there is a continuation of higher lows and higher highs (specially if 1363 is broken) that supports the idea that we are in an upward trend. For this trend to be clasified as impulsive we need to see 5 waves up completed. This has not happened yet. The fact that we see an overlapping move makes count these waves as 1-2s for the sake of a bullish view.

For this bullish count to be invalidated, the index must break its last low. That low is the area of 1310 cash. If that level is broken downwards, the decline could be very steep and markets will probably test 1260 levels. For this bullish count to be confirmed, the market must continue upwards unfolding a series of  3rd and 4th waves to complete extensions and the move from June.


 Technically speaking another fact that may support S&P and avoid a market crash is the pitchfork that has been placed in the weekly chart. S&P has tested the lower pitchfork support and has bounced upwards since then. Holding this support could give the index enough power to test the middle pitchfork resistance.


Another bullish indicator in a weekly chart is the crossing of my EMA. Although this might be a lagging indicator, combined with the fact that the index is above another pitchfork support is bullish enough for me.


Concluding I would like to note that bulls still have chances of survival despite the european debt fears and the possibility of a collapsing europe. As long as the wave count continues to be valid, and as long as support levels hold, bulls might have a good rally to expect over the next months.

Friday 29 June 2012

S&P in wave C up

Markets yesterday left the surprises for the end. If you are one of the lucky ones to have followed me in twitter and followed my view that we were in wave B down, you would expect an upward move to follow above wave A (1335). The first bearish scenario that we discussed in previous posts is going according to our view. There are many chances that wave X has ended and a new upward move with target above 1362 is underway. My secondary scenario had expected this upward move as part of  wave C of 2 relative to the impulsive wave down from 1362.
During premarket S&P futures are up more than 1,4% and this puts the cash price if the market opened now at 1348. This is a little bit above 61,8% retracement. You can choose to sell here with 1362 as a stop or wait for the market to break 1310 and be sure that the market is entering a 3rd impulsive wave down.

If you were based on the long side you still should have 1310 as a stop and hope for the market to break 1362. Yesterday's move gave a great chance for bulls to enter long positions so close to their stop. Depending on your longer term view, you can adjust on how you trade according to the price levels I give you.

Thank you for taking the time to read my post.


Thursday 28 June 2012

AAPL to reach 480$ or back above 600$?

AAPL has been moving sideways for almost a month, inside the 560$-590$ range. The drop from the April highs is not impulsive, but this doesn't rule out new lows below 522$. The rise AAPL has made from 522$ is not a clear impulsive upward movement and this makes me think that it might be an X wave. This means that another correction lower will follow. The first sign that such a decline is coming, will be the break of the upward gann fan support at 560$ and the break of the lower pitchfork support at 550$. The target of this move will be around 480$ or lower. If AAPL holds 550$ and makes an impulsive break above 590$, bulls would most probably be saved. 


Wednesday 27 June 2012

Dax in upward correction

Today we take a look at the German DAX index. The wave counts and possible wave scenarios are very similar to the US S&P and DJIA indices as previously discussed here. DAX has made a 3 wave upward move from June lows. This move was either the entire wave II or just the first part of the wave II correction. 

Support is found at the 6050-6100 area. Resistance lies at the June high of 6427. A move above 6312 will increase possibilities that we are in a more complex correction of wave II and the index will break recent June highs. Our view is downward biased for the longer term since 5 waves have completed from March highs. The fact that this decline lasted almost 3 months, cannot be corrected in just 3 weeks. I think it needs more time to correct this move. That is why I believe the wave II correction is more complex and far from over. Bears should be very cautious as a move above June highs is possible. Breaking support levels and June lows will only strengthen the scenario that wave II has been completed..

Tuesday 26 June 2012

A new downtrend begins in DJIA and S&P

Both DJIA and S&P have made downward impulsive moves from recent June highs. Both indices have made 5 waves down. Things couldn't be clearer as far as the wave struture is concerned. This could very well be the 1st minor wave of a larger 3rd wave that has targets towards 1100 S&P  and at least 11700 in DJIA. 

Alternatively, such a decline could be postponed if the market is in a process of a more complex wave 2 correction as mentioned in previous posts. In this case it is possibe that the market might move a little bit lower and then make a final upward move above June highs. Thus labeling this downward move as wave X.

Either way our longer term view remains downward biased. So now we wait for either a minor degree wave 2 or the 3rd and last part of the upward correction that begun in early June.

Monday 25 June 2012

EURUSD upward correction is over....

 EURUSD after a 3 week upward move from 1,2287 has reached our previously posted targets above 1,27. On the daily chart EUR/USD has made an overlapping upward move from June lows. It is very difficult to see this move as an impulsive one, that is why we mentioned many times that bears should be ready to pull the trigger once again. The pair didn't manage to break above the upper pitchfork resistance and has broken down more than 00 pips in 2 sessions. Additionally the daily chart has also broken the green upward support line that follows the move from June lows.
Taking a closer look at the 4hour chart, we see the same characteristics as in the daily chart. The upward move from june lows is not impulsive and the pair has broken the green support line. However we might find support near 1,2460-80 levels as the middle pitchfork support lies there. The pair might have a final upward move to retest the upper pitchfork resistance  near last weeks highs, but any bullish strength is getting weaker and weaker. Bears will regain control of the trend very soon with targets below June lows.

Friday 22 June 2012

Gold will soon make a big move


Gold has turned back inside the pitchfork resistance as it wasn't able to break 1642$. Gold's weakness has pushed prices towards 1560 near the 76,4% retracement. Support is found at 1550$, where the three lows (A-C-E) connect. Next support is found at the low of 1524$. Gold continues to move sideways inside the big triangle unable even to break above the blue pitchfork. Bulls want 1524$ to hold and an upward move to break 1642$. Bears feel more confident as gold got rejected at 1635$ and turned down in an impulsive form. Breaking 1524$ will at least give 100$ lower target at 1425$. If on the other hand Gold holds 1550$ and in the process breaks 1642$, the first target will be 1740-1800$.  

S&P road ahead

 After  our successful call that the top was in at the 1360 area, it is now time to see what is next. Our most probable scenario is based that trend  changed in May downwards with 5 impulsive waves. This move took almost 2 months to unfold. The correction towards 61,8% retracement took less than 3 weeks. Although price level has been achieved, I believe it needs more time to correct wave I.
We start with the daily chart and we can clearly see 3 waves up at the 61,8% retracement. Our second best scenario sees wave II completed and we are starting wave III. 1300 cash is an important support that if broken will increase the probabilities of this scenario. My most possible scenario expects the market to move downwards for wave X and then again upwards for the last part of the correction above 1362. In this case 1300 should hold in my opinion. But this is not a necessary rule of EWT.  My least probable scenario is bullish with a second lower degree impulse wave starting at 1305. This is the blue scenario as depicted in the intraday chart. For this scenario to hold 1305 should hold as it is the start of the lower degree wave i.  
Thank you for taking the time to read this post.

Thursday 21 June 2012

Gold pulls back

Gold has been on our focus for some time now since the 1550$ level. The triple bottom and the possibility that a huge wave 4 triangle has ended made us believe that a rise in Gold was about to start. Since then, Gold has risen almost 90 dollars. As the move progressed, Gold found resistance at the upper pitchfork. Although it managed to briefly climb above that resistance, it never was able to move away from it. Yesterday it moved back in below the resistance line. Additionally it didn't manage to break recent high at 1642$. For the rise to continue, it was essential that 1642 was broken.

As can be seen in the intraday chart, the move is far from impulsive. However if we are at the beginning of a new upward move, this kind of overlapping moves can be explained as a couple of 1-2 waves. 1546$ is important for bulls to hold and for the rise to continue, gold must first break 1625 and then 1642. Bears could see the lows at 1528 being tested, but they don't want 1625 and 1642 to be broken upwards.

At this point I prefer neutral positions. I will try to enter long positions again either above 1625 or 1575-80. Stop would ultimately be the 1520-30 level.

Tuesday 19 June 2012

Could we be in the end of the upward move?

 DJIA has reached 61.8% retracement relative to the May-June 5 wave decline. The form of the rise is still in 3 waves as expected. This could very well be an intermediate to long term top if this move does not unfold another 4th and a 5th wave upwards. Our target of 61.8% has been achieved and its time now to be vary carefull. With a Bernanke-FED speech tomorrow, things can turn really ugly if markets expect QE3 and none is offered. This price level could mark the end of wave II as depicted in the daily chart above. The move is almost or already finished.

In the intraday chart you can see that wave C could very well be finished. Support lies at the upward sloping trend line and prices should not overlap wave A high. If prices fall towards level A with an impulsive manner, then we could expect the June lows to be tested. This bearish scenario is the strongest one today. For bulls to increase their chances of survival, then the market must finish  5 waves upwards from June lows and eventually make new highs above 13300. Support of 12400 should hold and not be broken before 5 waves up are finished.

Long positions should be alerted if market moves below 12700 in impulsive waves. Short positions could be opened now but this decision solely depends on the risk profile everyone has, since the stop for bears right now is 13300. If 5 waves down are developed and support levels are broken, then we can lower the stop for the bears to the last high.


 Thank you for taking the time to read my post.

End of upward correction or new highs ahead in S&P?

 S&P is moving as expected during the last week. After having broken the inverted H&S is now moving towards the 1360-70 target mentioned in previous posts. The move in S&P from the June lows is most probably a wave 2 after the 5 down (1422-1370). The wave structure from June lows to now is in 3 waves. Wave 2 target from the inverted H&S coincides with the 61,8% retracement near 1362. Assuming that this is a corrective upward move, then it will probably be over in this or next week. We mentioned before that time was needed for this correction to unfold, at least until the end of the month.

Taking a closer look in the intraday chart we certainly see that wave C (or 3 for the bulls) is not finished yet. We clearly see 3 waves up and the 3rd is not finished yet. More upside is very possible towards 1360-70. Now if the index moves below 1305 any possibility for an impuslive move from 1270 will be zero. Bears want the index to move below 1305 after wave C is finished. Bulls want to complete this 3rd wave and then to be followed be a 4th and a 5th (to new highs favourably). So in the short term, prices are biased towards 1370. As long as no impulsive move from 1270 is completed, the intermediate and longer term trend will change to down. 1422 area is very important not to be broken if this market is to turn down soon. On the other hand 1270 should hold even if 5 waves up are completed.

Thank you for taking the time to read my post.

Monday 18 June 2012

EUR/USD euphoria fades, dollar strengthens

The impact from the greek election results was very clear in early Monday session in fx. EUR/USD opened with a gap up that reached 1,2750 area. This however was shortlived. The pair since then is sliding and during the european openning session it pulled back towards 1,2620. The move looks corrective but still in force. The pair bounced as expected at the lower pitchfork support and after testing the middle pitch fork, is now above that resistance. As long as it holds above 1,2550 the pair will try to reach upper pitchfork resistance at 1,28 area. As noted before bears should be on high alert to pull the trigger again.

GBP/USD has reached the 50% retracement and might still has power to move towards 1,59. The form of the rise is in 3 waves until now and still considered a counter move to the huge decline. Support level is at 1,5530.


Thank you for taking the time to read this post.

Friday 15 June 2012

Greek stocks turn strongly upwards

 Greek elections are going to take place this Sunday and everyone in europe has one eye on the result and the other on a sell button. Greek stocks on the other hand rallied the last two days. Banks made almost a 30% plus upward movement discounting the positive result of a New Democracy win.
 The market will interpret a New Democracy win as a good result. The market has already discounted part of the result. Increased volume and strong upward movement has pushed the index above resistance levels and outside of the downward sloping channels.

As can be seen in the following two daily charts, that depict National Bank of Greece and Eurobank, there are lots of similarities with the rally at the beginning of the year. Increased volume, break of resistances, break of downward sloping channels, break of EMA and the form of the rise look very similar to what happened in early January that resulted in a huge rally.


 First attainable target for prices to go after the elections is the level they were in early May during the first elections. NBG could test 1,70€ and if volume stays high and higher highs are made, the stock could reach 2€ and even higher. EUROBANK has not declined as much as NBG and has less road to cover to reach early May levels. At 0,70€ is the first resistance and the next one is at 1€.

 The positive scenario expects the market to continue to rally specially if  good election result is combined with steps taken by the ECB to help the european banking sector. The target of this scenario could be higher than the February highs.

The negative scenario will see the market rise only for a while after the elections as the pre election rally might have discounted any good result. If the newly appointed government in Greece after the elections shows the same inability to change things, the market will come back down. 

In the case that the leftist party SYRIZA wins the elections one thing is for sure...panic will prevail in the markets. The markets have shown that they preffer a New Democracy win and want to avoid any possibility that a government will be formed under the leftist party. It was rumored yesterday that central banks are prepared to encounter such an event by providing liquidity if needed.

Thursday 14 June 2012

S&P next stop at 1370 or 1260?

S&P has managed the last 3 sessions to fool both bears and bulls. After the sharp upward movement from 1270 to 1335, the index is consolidating between 1305-1330. Taking into consideration wave (III) and (IV) as the left shoulder, wave (V) as the head and the recent consolidation as the right shoulder, if the neckline at 1330-35 is broken then the target is 1370 cash. Apart from this inverted H&S pattern, the upper pitchfork resistance also lies at the same level as the neckline that needs to be broken for a rally to happen.

On the other hand, intraday analysis of the last 3 sessions, shows another H&S pattern that if broken downwards the decline will be steep. For this bearish scenario to come true, the neckline of the bearish H&S at 1305-1300 must break. Target of this H&S is 1260-70.

According to our most possible wave count, we expect the inverted H&S to materialise and the index to finally break 1330-35 and move towards 1370. That will most probably be the end of  wave 2. New highs above 1422 cancel this very bearish scenario.

Thank you for taking the time to read this post.

Wednesday 13 June 2012

AAPL trending upwards

A few days ago my bullish view on AAPL was posted (visit this link http://profitablerisktaking.blogspot.gr/2012/06/aapl-with-bullish-view.html). Today I just want to confirm that the wave counts are proceeding according to Elliott wave rules and the bullish scenario is intact.
As can be seen in the 10 minute chart, the stock has made another, lower degree, 5 waves up and 3 waves down at the 50% retracement. For the time being we expect the stock to continue upwards impulsively. First target is previous highs that pose the first resistance level. Below we have support near the 61,8% retracement 564$. It wouldn't be good for bulls AAPL to move below that retracement.

Thank you for taking the time to read this post.

Tuesday 12 June 2012

Time to turn up again?


Yesterday bulls got butchered. After the enthusiasm in pre market trading in response to the financial 'aid' to Spain, markets turned down as smart money sold the news. Now that short term lagging bulls are out of the picture (as short term lagging bears during the 12050-12650 move), the wave structure as wave B might already be complete. Now we expect an upward wave C. Wave A paused at the 38% retracement and a sideways movement  as wave B followed. A move above 12600 cash DJI will confirm that we are in wave C. However there is high possibility that this move is minor wave 2 and that's why bulls should be very cautious as a larger degree wave 3 down is expected. This scenario is depicted in the following chart.


Thank you for taking the time to read this post.


Enthusiasm fades, trend remains down in Greece

 Greek General index  tried yesterday to make a considerable upward move influenced by the financial aid given to Spain, but as expected the rally faded as time passed. Enthusiasm was high at the beginning of the session but it looked more like a trap. Many bears tried to cover short positions and many also tried to go long hoping for a trend change. I will say it once again, I prefer staying on the side with cash than trying to pick a bottom without any of my criteria being met. What are my criteria? Increased volume with impulsive move upwards and break of previous resistance levels. None of these criteria has been met. The general index just back tested the broken red support trend line and remains below my averages for some time now.


 The same stands for FTASE 20. The broken support has been back tested and no previous high surpassed. I see new lows ahead unless this index manages a move above 190-195 that could open the way towards 220-230.
National Bank of Greece although it tried to make a strong bounce yesterday, the selling pressures pushed this stock downwards. The yellow support line is our near term target since the upward move from 0,90 is not impulsive. We assume the downward trend will continue till the end of this week. After that nobody knows what could follow the weekend elections.

Monday 11 June 2012

Spanish aid pushes euro higher!Will it hold?

After the news announced on Saturday regarding the financial aid to Spain and its banking system, EUR/USD prices soar to new highs relative to Friday's session. The pair is trading late sunday near 1.27 after having opened with a gap up since it closed last Friday just above 1.25. Support lies now at Friday's low near 1.2430. The move from June lows still looks corrective as all moves are overlapping. There is no clear impulsive wave and as mentioned in previous posts, correction targets are 1.2650-1.27 and bears should be ready to pull the trigger again. The green support trend line should be the first alert for a trade signal if broken. The pair continues to make higher highs and higher lows. The correction finds strong resistance at 1.27-1.28 level. Now at 38% retracement from 1.3280, this could very well be the end of the rise. At these levels I would favor closing long positions and waiting to see a signal to go short again.

Thank you for taking the time to read this post.


Saturday 9 June 2012

Why markets rise despite fears of european collapse?

 Bearish sentiment has increased dramatically the last month. Fears for the european debt crisis, Greek upcoming elections and possibility of Spain in need  of a bailout plan has pushed both european and american markets downwards. EUR/USD  has been sold hard the last weeks and everyone seems to want to sell euros. The increased bearish sentiment is byitself one reason whe we were expecting markets to make a bottom soon. If every one had gone short who would be left to sell? Noone, that is why with elliott waves we can capture the markets movement and expect when a move is beginning or is at its final stage.

Looking at the DJI daily chart we see 5 waves down. Before the end of the 5th wave it was noted that the move from the highs could end anytime since we were at the final wave. The market bounced upwards almost 500 points in 2 days. With a bearish scenario as the most possible one yet, the countertrend rally is part of a larger correction. This correction will take the form of 3 waves and we probably have finished the first wave up or are about to.

Taking a closer look at the 30m chart in DJI we can see 5 waves up from 4 of June low. This can be wave A. The move from that high could very well be part of wave B down but it needs more time to unfold and for the wave structure to be clearer. When this wave B  is finished, we shall be able to calculate possible targets for wave C. All these wave counts take into consideration the bearish scenario that we started in April a new trend downwards. If this is not true we could very well see an impulsive move start from June lows. That is why I also labeled wave 1 the alternative to wave A.
 EUR/USD 6h chart looks similar in form and direction to the US indices. The worrying part of this chart is that the upward move still looks corrective as the past ones in March and April. In both these months lower highs and lower lows were made signalling weakness. After a long decline of more than 800 pips, the pair is bouncing upwards. If european and US indices are in a wave 2 stage, this means that the pair is most probably in a correction that could reach 1.27-1.28. After that is finished, new lows are ahead. Many fear the breaking of european union, others the collapse of the financial system.

Many people expect the euro to collapse, Greece to default, the prices to plummet in a deflationary spiral and financial markets to relive a year like 2008 in a scarier version. Call me contrarian but my experience tells me that in markets things go exactly the opposite from what most people expect them to. This doesn't mean that markets will go up either. The problems are there in europe and are very real. Elliott waves project rough times ahead for the markets unless something changes the next month or so. Time will tell and we must be prepared to adjust our strategy and trading.

Thank you for taking the time to read my post.

Friday 8 June 2012

What to expect next in DJIA

 Bullish wave count of wave 4 gets canceled as proposed wave 4 overlapped wave 1. Moreover the move from recent highs has an impulsive form. DJI has stepped out of the long term channel in the daily chart. First try was made to reenter but was not successfull. I don't think that new lows are on the way just yet.
Taking a closer look at the 30m chart, DJI has found resistance at the 38% retracement. Futures spiked yesterday during premarket in response to the rate cut in China, but as I mentioned in twitter we should have thought twice before labeling this as 'good' news. Most probably the market is now in correction status. I think until the end of June the market will not crash to new lows, instead it will form a corrective A-B-C towards 50% and 61,8% retracement. Currently we are at the start of this potential upward correction. A pullback was expected from yesterday to begin as the rise was too steep and too fast. 

Thank you for taking time to read this post.

Thursday 7 June 2012

Upward correction or new highs?

 The 5 wave down move is clear amongst major indices. The most possible scenario is that it is followed by a 3 wave upward correction. S&P daily chart shows clear impulsive move downwards with potential retracement target at the 61,8% level (1365). The decline took near 2 months to unfold. So the correction could be expected to end near end of July.


  DAX along with the other major european indices has also made 5 waves down with an extension in wave 1. Wave 3 was not the largest wave but also not the smallest. So our count remains valid under EW rules. DAX has 6150 as resistance and 5950 lows as support. 6600 is textbook retracement target
CAC found support at the middle pitchfork and finished 5 waves down from March top and has the same wave form as DAX. 3350 level is the 61,8% retracement target for potential wave II.
Eurostoxx bounced at the middle pitchfork again and as well ended 5 waves down with the 3rd wave not being the smallest. So again we expect a countertrend rally to push the index the next month or two towards 2300.
It is important to note that the basis of the wave count is that the markets have changed trend and are moving impulsively downwards. Normally second waves should be avoided in trading as they are corrective and can take many forms. However entering long positions near the lows in any given pullback could prove a wise choice if the markets made an important bottom on Monday. With such a big bounce from Monday lows, it is essential that S&P won't break the lows at 1270 area. In the case that our basic wave count is wrong and we just started a new upward move to new highs, the long positions will compensate for wrong wave labeling.

Wednesday 6 June 2012

Has EURUSD bottomed? temporarily?

 EURUSD has found suport at the middle pitchfork as expected but at a lower level than 1,2350 that we first mentioned as target. It finally has shown power to the upside to counter the large decline that has taken place in May. The form in the daily chart looks impulsive with a downward bias and any significant bounce will most probably find resistance at 1,26 and at 1,275 upper pitchfork. Bulls could take risk with a stop at the lows with a target at first resistance (1,26-1,2650). Bears should be ready to pull the trigger again.
Short term chart shows that if EURUSD breaks support now we could retest 1,2425. Resistance at 1,2545 is the first obstacle to reach 1,26 target for end of correction.

Tuesday 5 June 2012

AAPL with a bullish view

 Once again we revisit AAPL as it is a very popular stock among blog visitors and was requested several times to post an update. The move from the April highs is overlapping and no viable impulsive wave formation can be seen. Moreover the wave relationship between wave A and C is close to textbook examples. Our initial target around 530$ was achieved as mentioned in previous posts. The low at 522$ was followed by a 5 wave impulsive upward move as shown in the next chart.
 My count for the presence of an irregular B wave supports the bullish sentiment behind this stock along with the potential power to resume upward trend soon. Till now the stock has retraced 50% of the impulse from 522$ to 576$.
At the 50% retracement near 548$, the stock moved again upwards with a smaller degree 5 wave towards 567$. Although this move is not my favorite clear 5 wave formation, we can still count it as one. The stock has paused the decline between the 38.2% and 50% retracement in the area of the previous 4th wave. The correction is in 3 waves from 567$ top and could very well be over. Short term stops could be place at 548$. The low of 522$ could be another option for a stop level. Resistance at 565$ should be broken for short term upward move to continue. On a daily basis I don't want the stock below 520$ as the road to 450$ would be open.

Thank you for taking the time to read my posts.

Sunday 3 June 2012

Bears have the upper hand now.

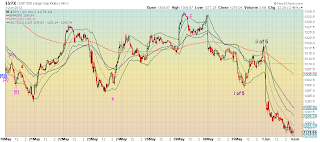
 Friday's session changed very important elements in wave counts for S&P. Breaking the low of 1291 canceled the possibility of being in a 3 wave decline from 1422. It also overlapped potential wave 1 top of October 2011. The move from 1422 March top is almost a perfect  textbook 5 wave. What we need now is for the 5th wave to be completed in 5 waves of lower degree. My target for the end of this 2 month move is 1250 area. 

Pitchfork support and wave relationship (wave 5= wave 1 and 3 *61,8) give me 1250 as most probable target. 1270 is the next most possible bottom and least possible is the area above 1200-10. Selling this decline is too risky if you take under consideration that we are in the final stages of this wave. The implications of such a decline and the fact that it cancels so many bullish scenarios is quite frightening.
 Long term support lies at the area of 1250 where the middle pitcfork also lies. Of course 1100 and 1000 levels if broken, 2008 bear market will be relived in greater magnitude. Lets hope we will not reach those levels.

Moving closer and zooming in the 5th wave of S&P we observe that we are in 3rd wave down. This 3rd wave might not be over yet, but if it is, a consolidating 4th wave below 1295 could give a short term bounce. 
The fact that the 1st wave of the 5th is extended, might mean that the 5th wave could be short lived. The 3rd wave of the 5th is already larger than wave 1 and wave 5 can take any size(wave 3 is not the smallest). That is another reason why I prefer to be patient when considering a  new short position. Wave 2 may follow and as we know, it will have to take as much time as wave 1 and may fool lots of people that the uptrend is back at play. This doesn't mean we shouldn't try and profit from such a scenario. Wave 2 could rise even up to 1350-60.

All the above are based on the assumption that 1422 is wave 2 of C top, and the 3rd wave of C started. Targets are below March 2009 low. The form and the time the market moves will give rise to bullish scenarios also that we will have to take under consideration. At this time however, bears have the upper hand.