Tuesday, 6 November 2012

DAX support and resistance levels

DAX has recently made a sideways movement with successive lower highs and lower lows. Although an overlapping pattern, traders should be very cautious with any long position. Short term support at 7300 and resistance at 7400 provide us with a trading range where we should be neutral. Very important support is at the 7100-140 level. Very important resistance is 7500. Trades should be made when resistance or support levels are broken. US elections could provide a bit of extra volatility in the next few sessions.

Prices still trade inside the upward blue channel and the bullish resumption of trend remains a good possibility. Breaking that channel downwards could push prices into a deeper correction.Another bearish sign that makes us be even more cautious is that the downward portions of this move feel impulsive, whereas the upward movements are corrective. Whether forming a longer term top or just an intermediate one, traders should be very cautious and ready to change strategy from long to short.

For more help trading this index, don't hesitate to contact me. Thank you for taking the time to read my new post.


Monday, 5 November 2012

Signs that SPX could fall towards 1330-60 level.


 SPX after having completed 5 waves up at Friday's open, prices pulled back sharply as expected in our last analysis. Whether bullish or bearish, a pull back was expected. Moreover, the index could not manage to break and stay above our middle pitchfork resistance. That is an important level (1432) for bears now, as  a move above it could accelerate prices towards 1445-47. Next target that needs to be broken by the bears is 1404 area. A break below that level could accelerate prices towards 1380-90.

 Watching the daily chart, we observe that prices remain outside the upward sloping channel and Friday's open  made a back test of the broken channel. Such behaviour could be a sign that a move towards the 200 EMA(1374) is very possible to happen. The sequence of lower highs and lower lows in the daily chart is also a bearish sign that prices could fall further.
 Last chart today to watch out over the longer term is the crossing signal of my two EMA indicators as a bearish sign of further price weakness. Usually prices decline considerably after such a signal. This crossing combined with a break of 1400 level could confirm that bears have taken over. 

US election talk on how the market is going to react to it leave me uninterested. I feel it is very possible wahtever outcome, that prices could fall further continuing their recent trend. Many believe that an Obama win could be bullish for the stocks while the opposite will happen if Romney wins. Any reaction like that I believe it wll be shortlived. I prefer to ignore the noise and just wait for prices to speak for themselves.

Always keep in mind the important support and resistance levels given in our charts. Thank you for taking the time to read my new post.

Friday, 2 November 2012

S&P wave count

Bulls managed yesterday to hold support and push prices much higher. Today we focus on what has changed in our wave counts given the new facts.

 For starters we have to cancel the bearish scenario that we were in wave 4 since it overlapped wave 1. Support at 1400 was held and bullish stop was not violated as mentioned yesterday. The bearish count calls for a second pair of 1-2 downward impulsive waves and we are currently in wave C of (2), which is about to top around 1442 (61,8% retracement). In pre market, prices have already reached 50% retracement. 

On the other hand bulls see the important low of 1397 not broken and the index rising upwards impulsively. At today's open the index will write a new high relative to yesterday. A pull back downwards and probably from 1440 level is expected whether the bigger picture is bullish or not. Resistance is now found at 1442 (61,8% retracement) and 1447 (upper pitchfork).

Critical support  at recent lows near 1404. If broken, then 1390-80 first target.

Greek General Index elliott wave count

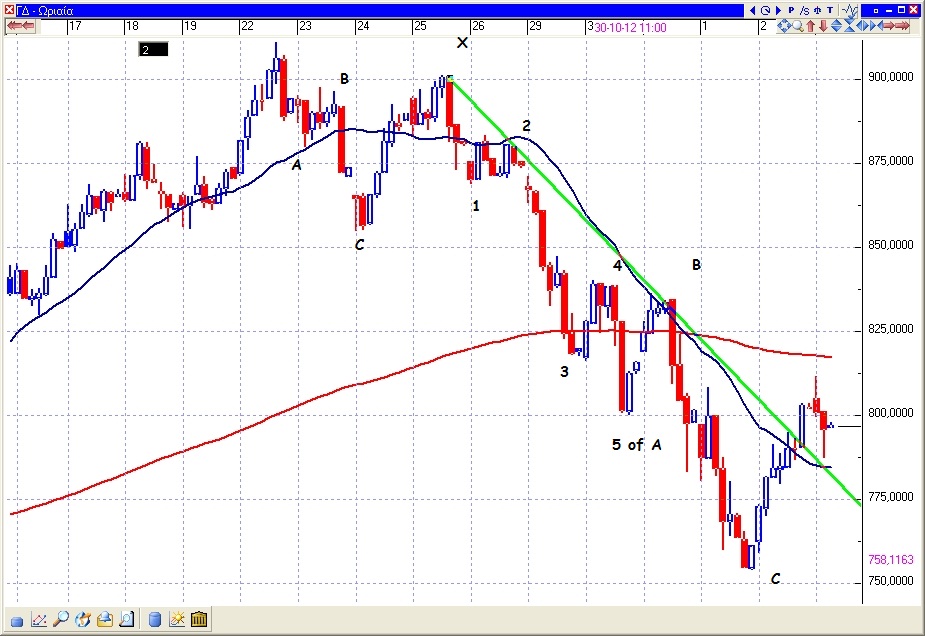
Greek stocks have rallied hard since June. At first glance we can oberve the 3 wave upward move in the index until late October. Now it is time for things to get clear, whether we are still in an upward impulsive move or in a new downward move. Lets start with the bullish scenario. As depicted on the chart we can count this sharp decline as wave 4. It has retraced as much as 50% of wave 3 and it is time now to start rising in the final 5th wave upwards. This might be the final upward wave but also the confirmation of a longer term trend change. Wave 3 was 1,618% of wave 1. Thus most probable wave 5 targets are:
  1.  wave 5 is equal to wave 1, near 950 level.
  2. wave 5 is 0,618 times of wave 1+3, near 1025 level
  3. wave 5 is 1,618 times of wave 1, just above 1050 level.
This does not mean that the market cannot go higher. However these are the most probable 5 wave terminal targets.

If the market however has finished a 3 wave upward correction at recent high 910, then a new downward impulsive has started. An initial confirmation that a new downward impulsive wave has started will be given if the high of wave 1 is overlapped(662 level). Targets are new lows with all its consequences.

If you need help trading greek stocks, don't hesitate contacting me.


Thank you for taking the time to read my post.

UPDATE:
 Update of the most possible, according to our analysis, wave count for the General Index. Impulsive upward waves should continue to form for this count to be valid. Until now, one upward impulsive wave has been formed. Minor pull back expected and continuation of upward move with new impulsive wave needed. Small possibility that downwave completed is only wave A of correction. Less possible that upward correction fully complete and new longer term downward move started.

Thursday, 1 November 2012

Impulse or correction?DJIA road ahead.

The aftermath of hurricane Sandy finds the markets trying to break above resistances early in the day but with no success. DJIA still trading inside the pitchfork but with no real direction in the last two sessions. From October highs, the index forms a 3 wave downward move. Short term trend remains downwards and it is more possible to see a new low as part of wave 5, assuming that this sideways movement is wave 4.  13039 low should be used as a stop for bulls, because if it is broken the market will most probably lose another 100 points at least. However this will be the final part of the decline that started from 13661 high. If the market on the other hand does not produce another low, the market will have only made 3 waves down. As mentioned many times before, when the market moves in 3 waves it is most certainly in a corrective phase. If the market holds this 3 wave downward pattern that would mean that a new bullish upward move will be starting soon. First obstacle for bulls will be the middle pitchfork resistance(13180-200). Next resistance that would cancel bearish wave counts is 13296 (wave 1 low). If prices move past that resistance, the impulsive wave count will be cancelled as wave 4 should not overlap wave 1.

Thank you for taking the time to read my new post.