Friday, 1 June 2012

GOLD is ready to rally!!!

GOLD is hovering above support line. Most chances are that the sideways triangular movement is over at 1530 area lows. From that low the move has been impulsive and then followed by a sideways correction. Breaking that low again will diminish the triangle bullish scenario. So long positions have a stop 20$ per ounce right now. Gold could visit 1546 where the 61,8 retracement of the rise will support Gold.

As shown in the short term chart above, the movement from the highs is  more sideways and overlapping than an impulsive one. So the decline is most probably corrective, which means that at least another leg up will follow.  So going long gold with a stop at 1528$ is my trading bet for today.


Thursday, 31 May 2012

S&P in correction wave 4 scenario

 The scenario that S&P is in wave 4 and a new low below 1290 will follow, is still very possible. S&P move from last low 1295 is not impulsive. From 1291 low the index has made 3 waves up. Wave relationships follow wave rules. Wave A is equal in size with wave C. However there is the possibility that this upward 3 wave move is just wave A, as the time it took to unfold is smaller relatively to wave 2.  Moreover a wave relationship near 1350 exists and this may be another target area. All this stands as long as 1291 low holds. If we see 5 wave down breaking that low, then wave 4 will prbably have ended. Wave 5 targets are found below 1270. The most possible target for wave 5 is 1255 where wave 5 is 61,8 times of wave 1 to 3. 1270 target is where wave 5 will equal wave 1. 1235 target is where wave 5 is 1,61 times wave 1. Again I will have to remind you that 1357 (wave 1 low) should not be overlapped if this is a wave 4. So adjust your trading stops accordingly.


Wednesday, 30 May 2012

Will european indices rise again or will they crash?

 DAX has bounced as expected towards 6450 but the resistance at those levels was too strong for the index to overcome. However I expect the index to resume the upward move soon. Initial resistance at the middle pitchfork is at 6400-6450. Breaking those levels will push the index much higher. Breaking 6250 would push long positions to liquidate and move the index towards  6100 support. DAX, as well as the other european indices, is much weaker than the american ones, but I see there is more chance as long as S&P holds, that europeans will turn up once more.
 CAC bounced as well from the middle pitchfork support and found resistance at the downward sloping trendline at 3100 level. Breaking this resistance is important for bulls to continue to have hopes for a move higher. 2950 where middle pitchfork support is now must hold for bulls to have chances. Breaking this line downwards would be a win for bears and a further push downwards will surely follow.
Eurostoxx moves similarly to CAC and DAX, but looks much weaker. Support at 2100 is important. Bulls want to keep that level and see the index break above 2200.I think european markets will turn upwards soon if S&P holds 1300-1295 level.

Thank you for taking the time to read this post, for more feel free to contact me.


Tuesday, 29 May 2012

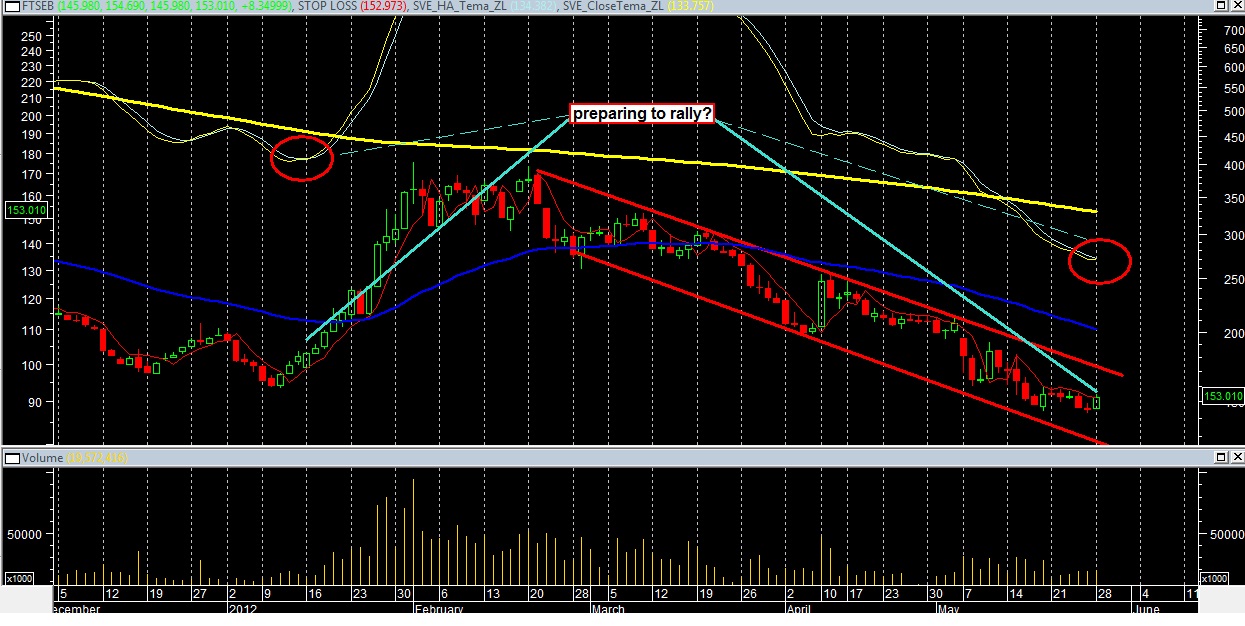
Can greek banking stocks turn upwards?

 Greek banks may once again look attractive for traders. The banking sector index is within its downward sloping trend channel. Recent polls regarding the June 17 elections have given yesterday a good boost to all stocks and specially banks. The longer this positive mood stays, the larger the move.  The index might be in a similar position as it was at the start of the year, where banking stocks rallied more than 100%. Of course the result of the elections will be crucial as to the possible money inflow in the market or potential outflows from the banking sector due to fears of collapse.
 National bank of Greece monthly chart (log scale) clearly depicts 5 waves downwards. I won't get into pointing out possible longer term wave counts because it doesn't help in trading. However I show this chart because I want to point out the increased possibility of a sharp market bounce. This doesn't mean that the stock couldn't fall even further. The 5th wave may continue much longer,  but being in a 5th wave also means that it is a terminal wave too. The upward reaction to such a multiyear decline will give us the chance to take small risks relative to the potential gains.
 Even in the daily chart of National Bank of Greece the downward sloping channel is getting narrower. A small sign of short term bottom was created yesterday. Closing above 1,31 and 1,45 will confirm the short term bottom.

Sunday, 27 May 2012

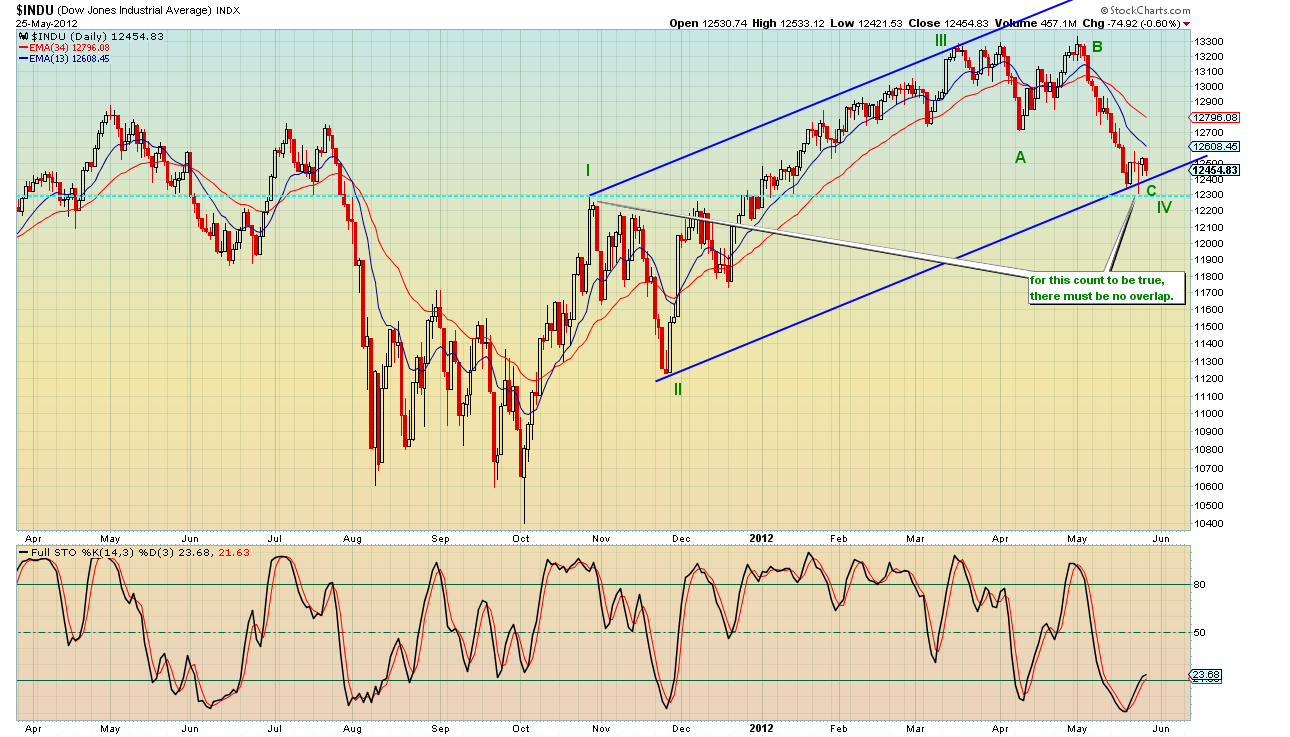
Rule of overlapping waves-Dow Jones

Things haven't changed much in Fridays session and nor bullish nor bearish scenarios got any stronger. This time we turn to DJI index and focus on the rule of overlapping waves of elliott wave theory. According to elliott wave theory, in an impulsive move, wave 4 should not overlap wave 1. Putting theory into action, we observe that DJI came very close. If the wave count depicted in the chart is the correct one, then we can assume that we won't see new lows, rather start a new upward move to new highs.
 
 Taking a closer look at the 60m chart, we observe that we can count 5 waves down from the highs within a channel and that the index has moved outside of the downward sloping channel. Bearish or bullish, whatever view you have, if you work with elliott waves you know that after 5 waves there comes a countermove. In this case, 5 waves down were part of a larger 3 wave correction and more specifically of wave C. If the next upward movement is in 3 waves, then the bearish scenario will strengthen. If we see 5 waves up we should expect 3 waves down and 5 more waves up. However this might prove to simplistic in real life and trading. Text book wave patterns do not happen very often and are not that clear in real life. However keeping things simple in counting waves is my major concern when trading with elliott waves.

Concluding we know what stop the bulls have after the recent 5 waves up (May 23rd low). Bear should wait 3 waves up before shorting again and cover positions until the low is broken.