Saturday, 31 March 2012

Greek FTASE 20

A follower in twitter wanted some info on my view for FTASE 20 and how deep can the correction go. We must first make the assumption that the Jan-Feb rise was wave 1 and we are now in wave 2. Strictly speaking using elliott waves, wave 2 that we are probably in can go all the way to the start of wave 1 but not further. However it is not what happens normally. Usually wave 2s retrace until 61.8% of wave 1. Sometimes they retrace until 76.8%. Emotionally a wave 2 like the one we are experiencing in FTASE20 makes us feel that the previous (downward) trend is resuming. If the waves we are assuming are correct, then I start openning a position at 61,8% but very lightly. I want to see first 5 waves up of any degree. A break of 76.8% in a  daily close wouldn't help bulls chances.

Another scenario we have to seriously think is that the rise from January to February is only wave A of a correction (trend remains downwards). Then we would most probably be in wave B. Wave B has made three waves until now and is at 61.8% of wave A. There is no rule that wave B can't go lower than the start of wave A(irregular wave B with extreme downward pressure). After that we would expect an upward wave C. 

These two scenarios have 40% chances each imho.

The scenario with the less chances is that the corrective wave started in January and finished in February. So we now resume the downward trend impulsively and we are at the start of a wave 3.

Whatever scenario will prevail, I will open long positions when
  1. I see an upward impulsive wave
  2. when volume increases as prices rise
  3. when previous highs are broken and higher lows are made
I don't want to pick a bottom and try to guess where the end of wave 2 or B is. For a quick trading setup I would only enter light near 61.8% but if I didn't see an upward move after 2 sessions I would close my position and wait for the 3 conditions above to be met.

Friday, 30 March 2012

Dollar weakness....

EURUSD made a back test yesterday as expected and mentioned in the analysis. It holds the 1,3250 area and remains above the upper pitchfork resistance. This should hold and push impulsively higher in order for 1,3450 to be achieved.


GBPUSD chart is as labeled in past analysis on this blog and confirms the bullish trend. Now @ 1,60 even more confirms the impulsive move upwards with targets at least near 1,62. It would be very bold to mention targets of 1,66-1,68 but it is too soon. Higher highs and higher lows confirm the upward trend. I believe it will continue to rise.


  DAX cfds as mentioned yesterday in twitter look like after reaching 61,8% retracement a 3-wave movement has completed and ready to resume the uptrend. 6735 should definately hold for the bullish scenario to have chances. 7150 should break for bullish scenario to increase chances. But this is the most bullish scenario. There are other possible scenarios that involve sideways correction that will take much longer to unfold, but we will have to wait to see price reaction near support and resistances.

Greek stocks continue downward trend but reached 61,8% retracement and bounced a bit at the end. Intraday analysis might justify an upward move due to the fact that five waves down have completed from last high(Intraday).

I won't enter this market unless I see 5 waves up with volume increased.


Thursday, 29 March 2012

Time for correction....S&P-DAX-GALE


 S&P has been rejected at the upward trend line noted yesterday. A pull back towards 1400 was also mentioned at yesterdays analysis and it seems that a bounce is coming now. I believe the consolidation and the sideways movement will continue today and tomorrow with an upward bias. Next week I see new highs.


DAX will probably hold 6900 and retest 7150. A sideways correction with more bias to higher prices is more probable for me. If support is broken then the correction will take more time imho.


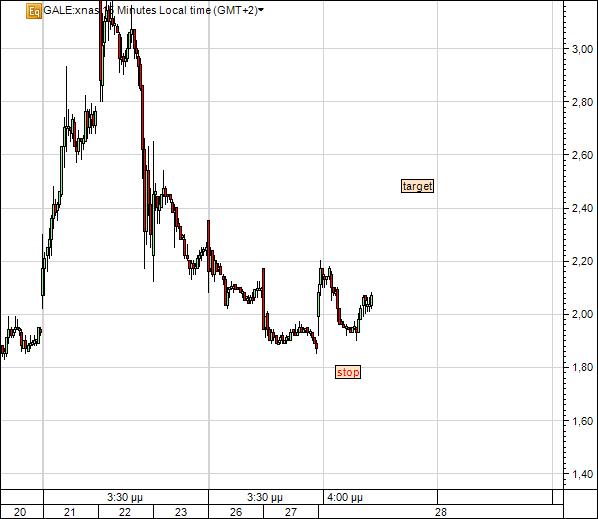
 Since the markets are correcting or moving sideways, I tend to pay more attention to selected stocks that  I think will have a better risk/return ratio. GALE used to be a favorite of mine at 1,50 were I entered.At 2,45 I exited and saw it rising up to 3$. Now I believe it might have finished its correction and ready to test the highs. Be very carefull if you decide to trade this stock....very volatile.

Wednesday, 28 March 2012

More sideways movement with upward bias

S&P has found the 1420 resistance and might move sideways for the rest of the week with attempts to break 1420. The trend remains up with 1385 initial support. Being above the mid-pitchfork may be a bullish sign but we might soon see a test of the support at 1400.


EURUSD has broken resistance and will most probably continue towards 1,34-35. Support that could be tested could be 1,33 level and support that should hold for trend to continue higher is 1,3250-1,3130.
A stock that I will have under serious consideration is MAKO Surgical Corp. I like the chart very much and I think over the next semester this stock will do extremely well.  First support at 40$.


 Athens FTASE20 looks like it will move lower. My view to stay on the sidelines because I don't see an impulsive wave up has saved me lots of money. Banks have been the worst performers the last few days. However I still have the view that we are in a corrective wave. It doesn't cost me to stay on the side and trade other markets (MIB, S&P, THLD, DAX) but this market will be always in my target sight as it has lots of potential in my opinion.

Tuesday, 27 March 2012

MIB-AAPL-THLD....did you take a profitable risk?

MIB as mentioned in twitter was one of my trades last week when I saw a bottom in the markets. It could very easily test the highs, but it will first have to break 16800 decisively because it is the 61,8% retracement. Support lies at yesterdays low. 


AAPL continues to follow the uptrend from December. I have a short term take profit stop at the area of 577$ and I think after yesterdays session the share will move towards $610-620 this week. Breaking 550$  could be a start of a larger correction.


 THLD gave a new high yesterday above 8$. Stop now at 6,70$. If today 8.50 is reached again I will try and sell it and get back in lower near 7,50-8$. Safest strategy is to hold with stops raising as share price rises.