Tuesday, 7 August 2012

AAPL with an eye on the upcoming iPhone5

Last time I posted an analysis on AAPL the stock was at 570$ after the earnings miss. I then mentioned the extremely important support level that the stock was at the time. Many of my blog followers took advantage of this analysis and now they ride this upward trend having raised the stop level according to their risk tolerance.

Technically speaking, the rise from 522.18$ still looks choppy with overlapping waves. Similar to the major US indices. April highs are being tested and bears are struggling in the corner. This pattern has the potential to unfold to a bigger upward move. Support levels on a daily basis are found at the 600$ level and at the 580$ level. Resistance is the previous high at 644$.

As shown in the 60 minute chart above AAPL is possible to make a pull back towards the middle Keltner channel support near 615$ or even 610$. The rise from 570$ looks impulsive. The possible wave counts are suggesting that it is very possible the rise from 570$ is over and a correction is due. So be careful with your long positions. For more help on how to trade this stock profitable, don't hesitate to contact me.

Thank you  for reading my post.

Sunday, 5 August 2012

Bulls VS Bears..the battle continues....(S&P)

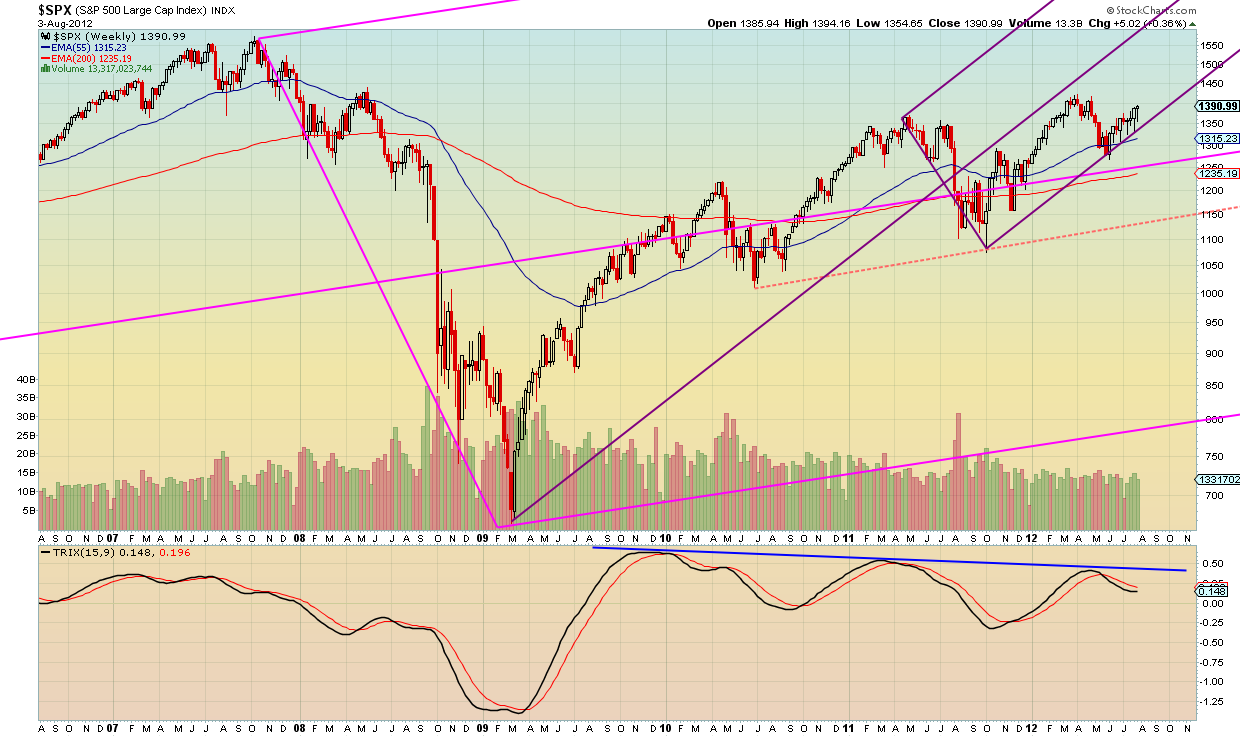
Can't say that the sharp pull back on Friday was something I was expecting, but since S&P is not breaking important support levels, then I will not put all my money in short positions. The market topped as expected at the area of 1390 and made a sharp decline towards 1355 still inside our upward trading range channel. A new high at 1394.16 has not changed anything to our strategy. The rise still looks choppy but at least the market does not fall. Unless support levels are broken, be on high alert of strong pull backs. 1354 is now a level that bulls don't want to break. It is not as important as 1325, but if broken could accelerate a decline below 1325.
Taking a look at the weekly charts, the index looks like it can hold its  support levels. The big pitchfork still holds prices in with an upward angle but with lots of volatility. The lower pitchfork support if broken could be another bearish sign. If it holds, the market can make new highs towards 1500.


Our simple EMA system also confirms this potential bullish view that 1500 could be achieved by the end of the year. It is a lagging indicator, but I always take it under serious consideration when trying to forecast large moves. Combined with elliott waves is a very usefull indicator.

If you want help and more in depth analysis for trading this index, don't hesitate to contact me. Thank you for taking the time to read my post.

Thursday, 2 August 2012

Upward correction not over in EURUSD

 I focus today in EURUD. Volatility will surely pick up during Draghi's speach but I favor the upside. As depicted in the chart I see 5 waves followed by 3 counter waves complete. According to wave theory another 5 wave pattern should follow the trend of the first 5 waves. The intermediate high at 1,2337 could prove my first resistance that if broken the pair could test 1,24. I could try and pick a bottom at these levels with 1,22 as a stop. That depends on how much risk anyone is willing to take. Another low below 1,22 could still happen in case the  downward correction is more complex.


Zooming out the chart we can see that the pair is above the middle pitchfork support and could test the upper pitchfork resistance at 1,25. With the resistance having  a downward slope, the pair could reach 1,2450.


Wednesday, 1 August 2012

Last chance for Greek stocks!!!

 Greece has been in the spotlight in recent months for all the negative reasons surrounding the european debt crisis. Greek stocks have plummeted during the past 3 years and prices have dropped to all time low levels for most stocks. So what now with the stocks? They will move even lower or sky rocket if a solution is found for european debt crisis.

From an elliott wave perspective the Athens General Index could have finished its corrective decline. If our wave count is correct, the market is expected to make a big upward move. This could be part of a bigger correction or even better the start of a new uptrend.

 Both Alpha Bank and National Bank of Greece show ealry signs that an upward movement might be close. The strength and size of this move could determine the future course of prices. A trend change or a larger degree correction?


What is important now for traders is the possibility for this market to outperform and even give more than 100% profits. Prices are some much pressured like a metal spring that will burst upwards when pressure is lifted. Stop levels are very close and potential targets are very high. So why not take a chance following a prudent strategy in order to enter this market?

If you want more info on how to trade in greek stocks and what strategy to follow don't hesitate to mail me. Thank you for taking the time to read my thoughts.

Time has come to start a new trend

We have witnessed for almost two months now a sideways movement in S&P and DJIA. The markets have retraced more than 61.8% of the April-May decline and I think August will be a very important month for the determination of our next targets.

As mentioned many times before in our analysis in this blog, the rise from early June is overlapping and has no clear impulsive characteristic. August 1st was our marked date for a change in trend. Our most probable scenario remains the expected decline to new lows. However market intervention by government officials in Europe and in the US might avert such decline. Even if the market is to continue higher, a downward correction towards the lower channel support, as depicted in both charts is expected. This overlapping  structure from early June could unfold into an impulsive upward wave, but the chances are that it is only a correction and that the downtrend from April-May will resume in August. 

Two days ago when DJIA was reaching 13000 and S&P 1385 I was posting my doubts that this rally will continue. Both markets seem like the have been rejected at their resistances and are pulling back down. I think August 1st will be a day that will provide us with the necessary info to as to where the market is heading and if bears will prevail as expected by our preferred scenario. Either way traders should always respect the resistance and support levels and use them as stop reverse triggers.

Thank you for taking the time to read my thoughts and feel free to comment.